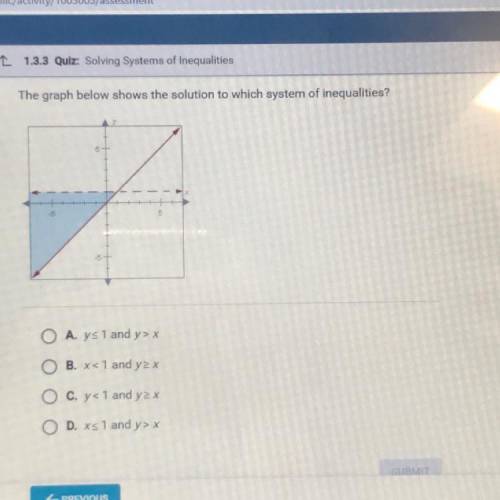
The graph below shows the solution to which system of inequalities?
5 +
at
-5
O...

Mathematics, 11.11.2021 01:40 mambaout
The graph below shows the solution to which system of inequalities?
5 +
at
-5
O A. ys 1 and y> x
B. x< 1 and y2 x
O C. y< 1 and y2 x
D. xs1 and y> x

Answers: 3


Other questions on the subject: Mathematics
Mathematics, 21.06.2019 17:00, Buttercream16
The graph of f(x), shown below, resembles the graph of g(x) = x2, but it has been changed somewhat. which of the following could be the equation of f(x)?
Answers: 2
You know the right answer?
Questions in other subjects:


Mathematics, 20.11.2019 20:31


Biology, 20.11.2019 20:31

Health, 20.11.2019 20:31
Mathematics, 20.11.2019 20:31

History, 20.11.2019 20:31


