
Mathematics, 04.11.2021 15:40 aguerobia
Giving 100 points to correct answer, FLVS 4.06.
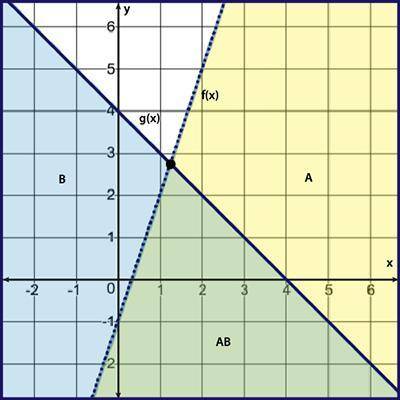
In the graph, the area below f(x) is shaded and labeled A, the area below g(x) is shaded and labeled B, and the area where f(x) and g(x) have shading in common is labeled AB.
The graph represents which system of inequalities?
y ≤ −3x − 1
y ≤ −x − 4
y > −3x + 1
y ≤ −x − 4
y < 3x − 1
y ≤ −x + 4
y ≤ 3x − 1
y ≥ −x + 4

Answers: 3


Other questions on the subject: Mathematics
Mathematics, 21.06.2019 21:30, ojbank4411
Tom can paint the fence in 12 hours, but if he works together with a friend they can finish the job in 8 hours. how long would it take for his friend to paint this fence alone?
Answers: 1
Mathematics, 22.06.2019 01:30, hela9astrid
This graph shows a portion of an odd function. use the graph to complete the table of values. x f(x) −2 −3 −4 −6 im sorry i cant get the graph up
Answers: 1
You know the right answer?
Giving 100 points to correct answer, FLVS 4.06.
In the graph, the area below f(x) is shaded and la...
Questions in other subjects:
Mathematics, 10.03.2021 17:50

Mathematics, 10.03.2021 17:50

Mathematics, 10.03.2021 17:50
Mathematics, 10.03.2021 17:50
Mathematics, 10.03.2021 17:50
Mathematics, 10.03.2021 17:50


