
Mathematics, 04.11.2021 09:10 spacehunter22
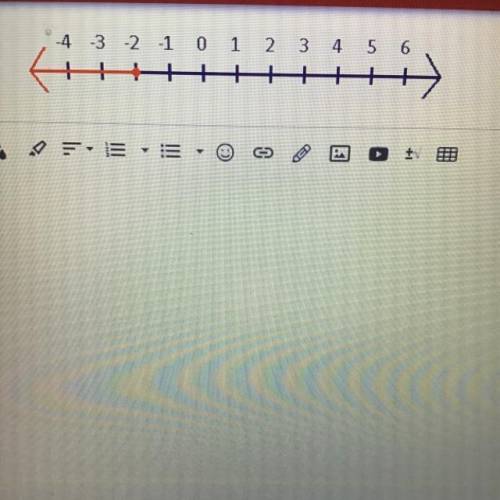
What inequality is shown on this graph (the negative signs image hard to see but some of them are negative)

Answers: 3


Other questions on the subject: Mathematics
Mathematics, 21.06.2019 16:30, safiyabrowne7286
How do you summarize data in a two-way frequency table?
Answers: 3
Mathematics, 21.06.2019 18:30, guillianaroberts
Water flows at a steady rate from a tap. its takes 40 seconds to fill a 4 litre watering can from the tap. the rate at which water flows from the tap is halved. complete: 4 litres into cm3
Answers: 3
Mathematics, 21.06.2019 19:30, kataldaine
Which of the following describes the symmetry of the graph of y = x3?
Answers: 2
Mathematics, 21.06.2019 20:10, jackfrost5
The population of a small rural town in the year 2006 was 2,459. the population can be modeled by the function below, where f(x residents and t is the number of years elapsed since 2006. f(t) = 2,459(0.92)
Answers: 1
You know the right answer?
What inequality is shown on this graph (the negative signs image hard to see but some of them are ne...
Questions in other subjects:


Mathematics, 30.12.2019 13:31

Physics, 30.12.2019 13:31
History, 30.12.2019 13:31
History, 30.12.2019 13:31


