
Mathematics, 02.11.2021 22:10 nakaylafree
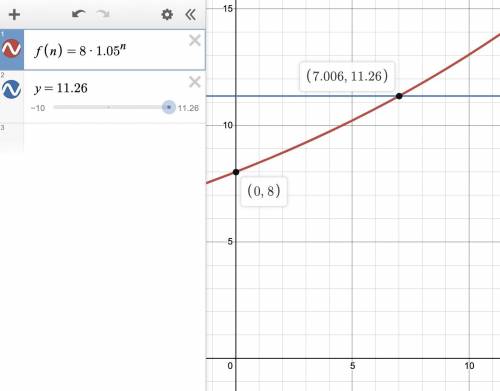
A scientist is studying the growth of a particular species of plant. He writes the following equation to show the height of the plant f(n), in cm, after n days:
f(n) = 8(1.05)^n
Part A: When the scientist concluded his study, the height of the plant was approximately 11.26 cm. What is a reasonable domain to plot the growth function?
Part B: What does the y-intercept of the graph of the function f(n) represent?

Answers: 1


Other questions on the subject: Mathematics
Mathematics, 21.06.2019 20:10, tiggyandrep2dbee
Look at the hyperbola graphed below. the hyperbola gets very close to the red lines on the graph, but it never touches them. which term describes each of the red lines? o o o o a. asymptote b. directrix c. focus d. axis
Answers: 3
Mathematics, 21.06.2019 22:00, rwlockwood1
If my mom gets $13.05 an hour, and she works from 3: 30 to 10: 45 in the morning, how much money does my mom make?
Answers: 1
Mathematics, 22.06.2019 00:30, PollyB1896
Which is an x-intercept of the graphed function? (0, 4) (–1, 0) (4, 0) (0, –1)
Answers: 2
You know the right answer?
A scientist is studying the growth of a particular species of plant. He writes the following equatio...
Questions in other subjects:


Mathematics, 20.09.2020 04:01

History, 20.09.2020 04:01


