Which graph represents the compound inequality?
n<-2 or n24
-5 -4 -3 -2 -1 0 1
2 3<...

Mathematics, 30.10.2021 21:40 ahrozycki
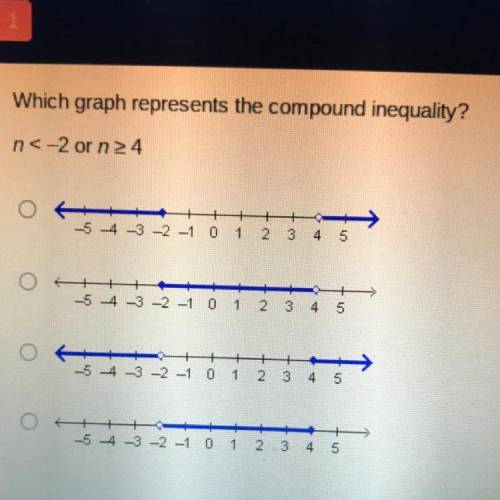
Which graph represents the compound inequality?
n<-2 or n24
-5 -4 -3 -2 -1 0 1
2 3
4
5
O
-5 4 -3 -2 -1 0 1
2
3
4 5
-5 4 -3 -2 -1 0
1
2
3
4 5
o
A+++
-5 4 -3 -2 -1 0 1 2 3 4 5

Answers: 1


Other questions on the subject: Mathematics
Mathematics, 21.06.2019 20:00, villarrealc1987
The function models the number of accidents per 50 million miles driven as a function
Answers: 1
Mathematics, 21.06.2019 20:00, lucerogon7403
How can you construct perpendicular lines and prove theorems about perpendicular lines
Answers: 3
Mathematics, 22.06.2019 02:20, traphard979
Find the probability that -0.3203 < = z < = -0.0287 find the probability that -0.5156 < = z < = 1.4215 find the probability that 0.1269 < = z < = 0.6772
Answers: 2
Mathematics, 22.06.2019 02:30, QueenNerdy889
Which statement best explains whether the table represents a linear or nonlinear function? input (x) output (y) 2 5 4 10 6 15 8 20 it is a linear function because the input values are increasing. it is a nonlinear function because the output values are increasing. it is a linear function because there is a constant rate of change in both the input and output. it is a nonlinear function because there is a constant rate of change in both the input and output.
Answers: 3
You know the right answer?
Questions in other subjects:


Arts, 11.11.2020 17:50


