
Mathematics, 27.10.2021 23:40 andrejr0330jr
Step 3: Making predictions using data
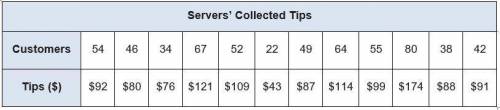
You and your business partner track the number of customers served and the amount of tips collected per day. The data you gathered is displayed in the chart below.
Servers’ Collected Tips
Customers 54 46 34 67 52 22 49 64 55 80 38 42
Tips ($) $92 $80 $76 $121 $109 $43 $87 $114 $99 $174 $88 $91
a) Create a scatterplot displaying the data in the table. Be sure to include a linear trend line. (2 points)
b) Find the equation of the trend line (line of best fit). Show your work. (2 points)
c) Predict the amount of tips that would be collected if 100 customers were served at the restaurant on a given day. Explain your reasoning. (2 points)
d) Explain how to use the regression calculator to make a reasonable prediction given a data table. (2 points)
100 points!

Answers: 3


Other questions on the subject: Mathematics
Mathematics, 21.06.2019 20:00, villarrealc1987
The function models the number of accidents per 50 million miles driven as a function
Answers: 1
Mathematics, 21.06.2019 20:00, raularriaga
You have 138.72 in your saving account u take out 45.23 and 18.00 you deposit 75.85 into your account
Answers: 1
Mathematics, 21.06.2019 20:30, jtorres0520
Two angles are complementary. the larger angle is 36 more than the smaller angle. what is the measure of the larger angle?
Answers: 2
You know the right answer?
Step 3: Making predictions using data
You and your business partner track the number of customers...
Questions in other subjects:
Mathematics, 01.07.2019 07:00
Mathematics, 01.07.2019 07:00

Social Studies, 01.07.2019 07:00


Mathematics, 01.07.2019 07:00

Computers and Technology, 01.07.2019 07:00


