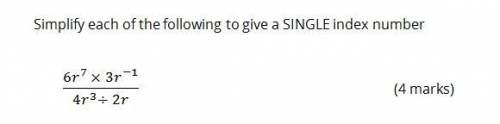
Simplify
...

Mathematics, 27.10.2021 20:40 ChanceJ
Simplify

Answers: 3


Other questions on the subject: Mathematics
Mathematics, 21.06.2019 16:00, kell22wolf
Part one: measurements 1. measure your own height and arm span (from finger-tip to finger-tip) in inches. you will likely need some from a parent, guardian, or sibling to get accurate measurements. record your measurements on the "data record" document. use the "data record" to you complete part two of this project. name relationship to student x height in inches y arm span in inches archie dad 72 72 ginelle mom 65 66 sarah sister 64 65 meleah sister 66 3/4 67 rachel sister 53 1/2 53 emily auntie 66 1/2 66 hannah myself 66 1/2 69 part two: representation of data with plots 1. using graphing software of your choice, create a scatter plot of your data. predict the line of best fit, and sketch it on your graph. part three: the line of best fit include your scatter plot and the answers to the following questions in your word processing document 1. 1. which variable did you plot on the x-axis, and which variable did you plot on the y-axis? explain why you assigned the variables in that way. 2. write the equation of the line of best fit using the slope-intercept formula $y = mx + b$. show all your work, including the points used to determine the slope and how the equation was determined. 3. what does the slope of the line represent within the context of your graph? what does the y-intercept represent? 5. use the line of best fit to you to describe the data correlation.
Answers: 2
Mathematics, 21.06.2019 16:30, emilyanneK2540
Jackie purchased 3 bottles of water and 2 cups of coffee for a family for $7.35. brian bought 4 bottles of water and 1 cup of coffee for his family for $7.15. how much does each bottle of water cost? how much does each cup of coffee cost? i need this done
Answers: 3
Mathematics, 21.06.2019 20:50, brea2006
An automobile assembly line operation has a scheduled mean completion time, μ, of 12 minutes. the standard deviation of completion times is 1.6 minutes. it is claimed that, under new management, the mean completion time has decreased. to test this claim, a random sample of 33 completion times under new management was taken. the sample had a mean of 11.2 minutes. assume that the population is normally distributed. can we support, at the 0.05 level of significance, the claim that the mean completion time has decreased under new management? assume that the standard deviation of completion times has not changed.
Answers: 3
Mathematics, 22.06.2019 00:00, rafamoreura
Which of the following will form the composite function?
Answers: 1
You know the right answer?
Questions in other subjects:
Mathematics, 09.09.2020 14:01
Mathematics, 09.09.2020 14:01
Mathematics, 09.09.2020 14:01
Mathematics, 09.09.2020 14:01
Mathematics, 09.09.2020 14:01
Mathematics, 09.09.2020 14:01

Biology, 09.09.2020 14:01

Social Studies, 09.09.2020 14:01
Mathematics, 09.09.2020 14:01
Mathematics, 09.09.2020 14:01


