
Mathematics, 27.10.2021 08:30 19dansiste
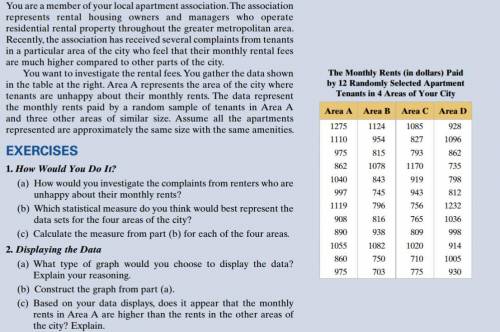
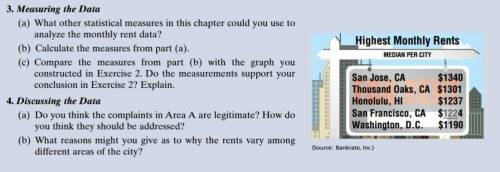
Please help in exercises 1. how would you do it, 2. displaying the data, 3. measuring the data, and 4. discussing the data.

Answers: 3


Other questions on the subject: Mathematics
Mathematics, 21.06.2019 12:30, jcastronakaya
Kenzie lives 30 kilometers from her cousin houde she drives 23 kilometers before stopping for gas how many meters does she need to travel
Answers: 1
Mathematics, 21.06.2019 16:30, eliascampos823
Which choice represents the sample space ,s for this event
Answers: 3
Mathematics, 21.06.2019 18:00, xxaurorabluexx
Suppose you are going to graph the data in the table. minutes temperature (°c) 0 -2 1 1 2 3 3 4 4 5 5 -4 6 2 7 -3 what data should be represented on each axis, and what should the axis increments be? x-axis: minutes in increments of 1; y-axis: temperature in increments of 5 x-axis: temperature in increments of 5; y-axis: minutes in increments of 1 x-axis: minutes in increments of 1; y-axis: temperature in increments of 1 x-axis: temperature in increments of 1; y-axis: minutes in increments of 5
Answers: 2
Mathematics, 21.06.2019 20:00, heavenwagner
Marcus and cody both leave the park at the same time, but in opposite directions. if cody travels 6 mph faster than marcus and after 4 hours they are 64 miles apart, how fast is each traveling? solve using rare times time = distance.
Answers: 1
You know the right answer?
Please help in exercises 1. how would you do it, 2. displaying the data, 3. measuring the data, and...
Questions in other subjects:
Mathematics, 14.04.2020 16:00


Spanish, 14.04.2020 16:00
English, 14.04.2020 16:00


