
Mathematics, 24.10.2021 15:00 shealwaysknows23
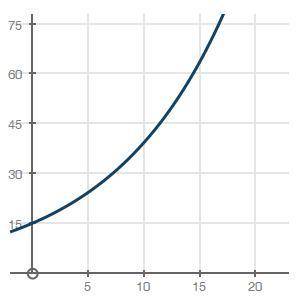
Jane is studying the rate at which the sale of a particular brand of chocolate has increased over the years. The graph below shows the number of bars sold, y, in thousands, after x years since the year 2000:
graph of y equals 15 multiplied by 1.1 to the power of x
What does the y-intercept of the graph represent?
A) Price of a bar of chocolate
B) Number of bars sold in 2000
C) Number of bars sold before 2000
D) Rate of increase in the sale of chocolates

Answers: 2


Other questions on the subject: Mathematics
Mathematics, 21.06.2019 15:00, ejcastilllo
Let the mean of the population be 38 instances of from 6" - 9" hatchings per nest, and let the standard deviation of the mean be 3. what sample mean would have a confidence level of 95% or a 2.5% margin of error?
Answers: 1
Mathematics, 21.06.2019 19:20, Courtneymorris19
Which of the following is the result of expanding the series
Answers: 1
You know the right answer?
Jane is studying the rate at which the sale of a particular brand of chocolate has increased over th...
Questions in other subjects:

Physics, 18.03.2021 21:10
Mathematics, 18.03.2021 21:10

History, 18.03.2021 21:10
Mathematics, 18.03.2021 21:10

Spanish, 18.03.2021 21:10
Mathematics, 18.03.2021 21:10


