
Mathematics, 20.10.2021 14:50 nikkibby13
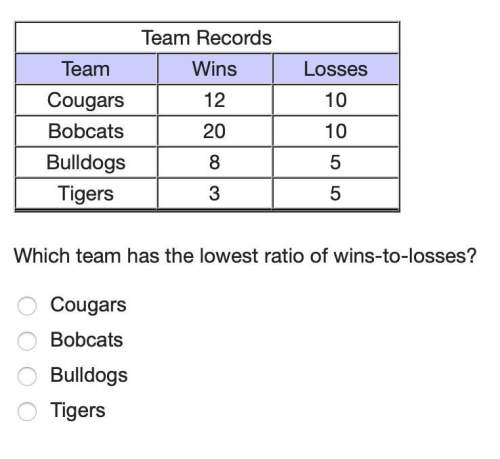
The graph in the figure shows the Smith family's driving plan for their vacation. If they want to stop and eat lunch after they've driven for 4 hours, how far will they have driven by lunchtime?
A) 90 miles
B) 180 miles
C) 120 miles
D) 60 miles


Answers: 2


Other questions on the subject: Mathematics
Mathematics, 21.06.2019 20:20, kenken2583
Complete the input-output table for the linear function y = 3x. complete the input-output table for the linear function y = 3x. a = b = c =
Answers: 2
Mathematics, 22.06.2019 02:00, Jeremiahcornelis
Yolanda wanted to buy a total of 6 pounds of mixed nuts and dried fruit for a party she paid 21.60 for mixed nuts and 11.90 for dried fruit did yolanda but enough mixed nuts and dried fruit for the party
Answers: 2
Mathematics, 22.06.2019 04:00, kalawson2019
The graph below represents which system of inequalities? a. y< -2x+6 y< (or equal to) x+2 b. y< (or equal to) -2x+6 y c. y< 2/3 x - 2 y> (or equal to) 2x +2 d. none of the above
Answers: 2
You know the right answer?
The graph in the figure shows the Smith family's driving plan for their vacation. If they want to st...
Questions in other subjects:

English, 20.10.2021 04:10
English, 20.10.2021 04:10

History, 20.10.2021 04:10


Mathematics, 20.10.2021 04:10
SAT, 20.10.2021 04:10


