
Mathematics, 20.10.2021 09:20 SketchWasTaken
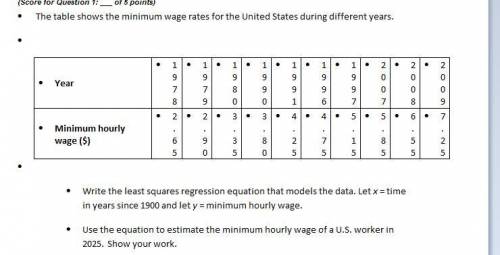
The table shows the minimum wage rates for the United States during different years.
Year 1978 1979 1980 1990 1991 1996 1997 2007 2008 2009
Minimum hourly wage 2.65 2.90 3.35 3.80 4.25 4.75 5.15 5.85 6.55 7.25
(a) Write the least squares regression equation that models the data. Let x = time in years since 1900 and let y = minimum hourly wage.
(b) Use the equation to estimate the minimum hourly wage of a U. S. worker in 2025. Show your work.
PLS ANSWER CORRECTLY WITH AN EXPLANATION

Answers: 2


Other questions on the subject: Mathematics
Mathematics, 21.06.2019 14:00, Pauline3607
Use the knowledge of x- and y- intercepts to choose the correct graph of the equation 3x+6y=6
Answers: 1
Mathematics, 21.06.2019 15:50, annadson4589
Astandard deck of cards contains 52 cards. one card is selected from the deck. (a) compute the probability of randomly selecting a seven or king. (b) compute the probability of randomly selecting a seven or king or jack. (c) compute the probability of randomly selecting a queen or spade.
Answers: 2
You know the right answer?
The table shows the minimum wage rates for the United States during different years.
Year 1978 197...
Questions in other subjects:

Computers and Technology, 30.06.2019 05:00
Mathematics, 30.06.2019 05:00

Physics, 30.06.2019 05:00

Social Studies, 30.06.2019 05:00

Health, 30.06.2019 05:00


English, 30.06.2019 05:00


