3-10. JOHN'S GIANT REDWOOD,
John found the data in the table below about his
favorite redwoo...

Mathematics, 19.10.2021 18:00 emmanuel180
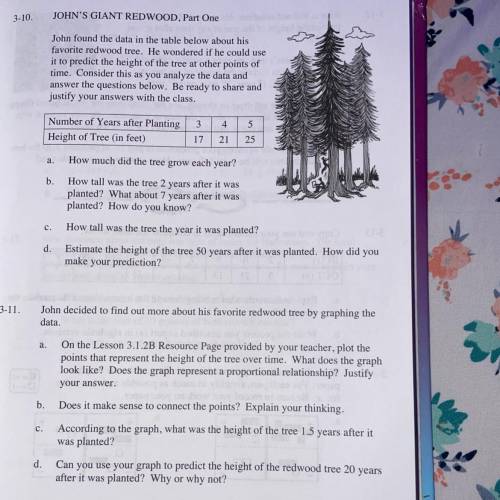
3-10. JOHN'S GIANT REDWOOD,
John found the data in the table below about his
favorite redwood tree. He wondered if he could use
it to predict the height of the tree other points of
time. Consider this as you analyze the data and A
answer the questions below. Be ready to share and
justify your answers with the class.
Number of Years after Planting
3 | 4 | 5
Height of Tree (in feet)
17 | 21 | 25
a. How much did the tree grow each year?
b. How tall was the tree 2 years after it was
planted? What about 7 years after it was
planted? How do you know?
c. How tall was the tree the year it was planted?
d. Estimate the height of the tree 50 years after it was planted. How did you
make your prediction?
3-11. John decided to find out more about his favorite redwood tree by graphing the
data.
a. On the Lesson 3.1.2B Resource Page provided by your teacher, plot the
points that represent the height of the tree over time. What does the graph
look like? Does the graph represent a proportional relationship? Justify
your answer.
b. Does it make sense to connect the points? Explain your thinking.
c. According to the graph, what was the height of the tree 1.5 years after it
was planted?
d. Can you use your graph to predict the height of the redwood tree 20 years
after it was planted? Why or why not?

Answers: 1


Other questions on the subject: Mathematics
Mathematics, 21.06.2019 21:00, bloodmoonangel01
Deepak plotted these points on the number line. point a: –0.3 point b: – 3 4 point c: – 11 4 point d: –0.7 which point did he plot incorrectly?
Answers: 2
Mathematics, 21.06.2019 23:00, Baby010391
Which radical expression is a rational number? a. √ 360 b. √ 644 c. √ 225 d. √ 122
Answers: 1
Mathematics, 22.06.2019 03:20, Jspice2199
The equation ip| = 2 represents the total number of points that can be earned or lost during one turn of a game. which best describes how many points can be earned or lost during one turn?
Answers: 2
You know the right answer?
Questions in other subjects:

English, 20.05.2021 07:00

Spanish, 20.05.2021 07:00

Social Studies, 20.05.2021 07:00
Social Studies, 20.05.2021 07:00
Mathematics, 20.05.2021 07:00


