
Mathematics, 07.10.2021 14:00 shimmerandshine1
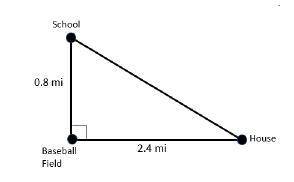
Javier walked from the school to the baseball field and then to his house. The diagram shows the top view of the locations of these three places and their distance from each other.
Which measurement is closest to the shortest distance in miles from Javier’s house to the school?
6.4 mi
2.3 mi
3.2 mi
2.5 mi

Answers: 3


Other questions on the subject: Mathematics
Mathematics, 21.06.2019 22:10, BilliePaul95
Ellen makes and sells bookmarks. she graphs the number of bookmarks sold compared to the total money earned. why is the rate of change for the function graphed to the left?
Answers: 1
Mathematics, 22.06.2019 02:00, mathhelppls14
1. the manager of collins import autos believes the number of cars sold in a day (q) depends on two factors: (1) the number of hours the dealership is open (h) and (2) the number of salespersons working that day (s). after collecting data for two months (53 days), the manager estimates the following log-linear model: q 4 equation 1 a. explain, how to transform the log-linear model into linear form that can be estimated using multiple regression analysis. the computer output for the multiple regression analysis is shown below: q4 table b. how do you interpret coefficients b and c? if the dealership increases the number of salespersons by 20%, what will be the percentage increase in daily sales? c. test the overall model for statistical significance at the 5% significance level. d. what percent of the total variation in daily auto sales is explained by this equation? what could you suggest to increase this percentage? e. test the intercept for statistical significance at the 5% level of significance. if h and s both equal 0, are sales expected to be 0? explain why or why not? f. test the estimated coefficient b for statistical significance. if the dealership decreases its hours of operation by 10%, what is the expected impact on daily sales?
Answers: 2
You know the right answer?
Javier walked from the school to the baseball field and then to his house. The diagram shows the top...
Questions in other subjects:

Chemistry, 22.01.2021 20:40
Mathematics, 22.01.2021 20:40
Mathematics, 22.01.2021 20:40

History, 22.01.2021 20:40

Mathematics, 22.01.2021 20:40

Mathematics, 22.01.2021 20:40

English, 22.01.2021 20:40


