Mathematics, 06.10.2021 20:00 makaylamsikahema
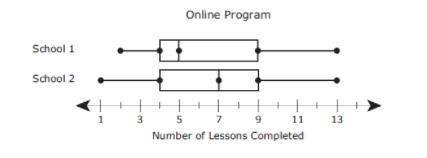
The box plots show the numbers of lessons completed by individual students enrolled in an online program at two different schools.
Which statement is best supported by the data in the box plots?
The interquartile range of the data for School 2 is greater than the median of the data for School 1.
The Interquartile range of the data for School 2 is greater than the interquartile range of the data for School 1.
The median of the data for School 2 is greater than the median of the data for School 1.
The range of the data for School 1 is greater than the range of the data for School 2.


Answers: 1


Other questions on the subject: Mathematics

Mathematics, 21.06.2019 13:30, CameronVand21
The vertex of this parabola is at (-2, 5). which of the following could be it’s equation? a. y=3(x+2)^2-5 b. y=3(x-2)^2-5 c. y=3(x+2)^2+5 d. y=3(x-2)^2+5
Answers: 1


Mathematics, 21.06.2019 19:20, maisieisdabomb23
What is the measure of ac? 5 units 13 units 26 units 39 units 3x- 2b 6x + 9
Answers: 2

You know the right answer?
The box plots show the numbers of lessons completed by individual students enrolled in an online pro...
Questions in other subjects:


Mathematics, 20.10.2021 22:30

Social Studies, 20.10.2021 22:30

Computers and Technology, 20.10.2021 22:30


