
Mathematics, 05.10.2021 14:00 FailingstudentXD
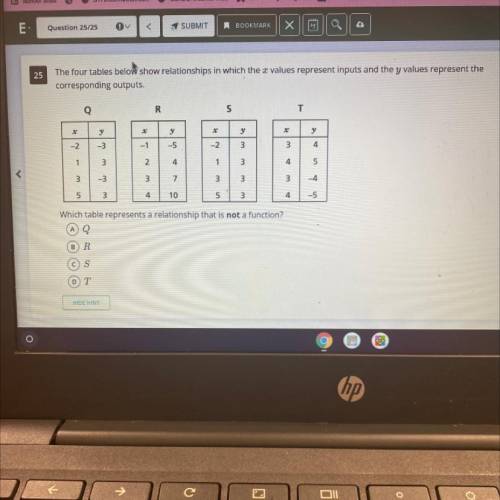
The four tables below show relationships in which the values represent inputs and the y values represent the
corresponding outputs.
Q
R
s
T
५
y
у
y
-2
-3
-1
-5
-2
3
3
4
1
2.
4
1
3
4
5
بیا بن
3
3
7
3
3
3
-4
5
3
4
10
5
3
4
-5
Which table represents a relationship that is not a function?
AQ
BR
S
DT

Answers: 2


Other questions on the subject: Mathematics
Mathematics, 21.06.2019 18:30, macylen3900
Jamie went to home depot. she bought 25 bags of soil that cost $9 per bag. she bought 15 pots at $8 each, and she bought 23 bags of pebbles at $15 each. she used a coupon that gave her $5 off for every 100 dollars she spent. how much did jame pay at the end?
Answers: 1
Mathematics, 21.06.2019 20:00, duhitzmay4693
The scatterplot below shows the number of hours that students read weekly and the number of hours that they spend on chores weekly. which statement about the scatterplot is true?
Answers: 2
Mathematics, 21.06.2019 20:00, andrejr0330jr
I’m stuck on this equation, anyone got the answer?
Answers: 1
Mathematics, 21.06.2019 21:30, coontcakes
Acd that is originally priced at $15.85 red-tagged for the sale. what is the sale price of the cd
Answers: 1
You know the right answer?
The four tables below show relationships in which the values represent inputs and the y values repre...
Questions in other subjects:
Mathematics, 14.11.2019 12:31

Biology, 14.11.2019 12:31


Social Studies, 14.11.2019 12:31
Social Studies, 14.11.2019 12:31
Mathematics, 14.11.2019 12:31


