
Mathematics, 05.10.2021 04:00 cat706
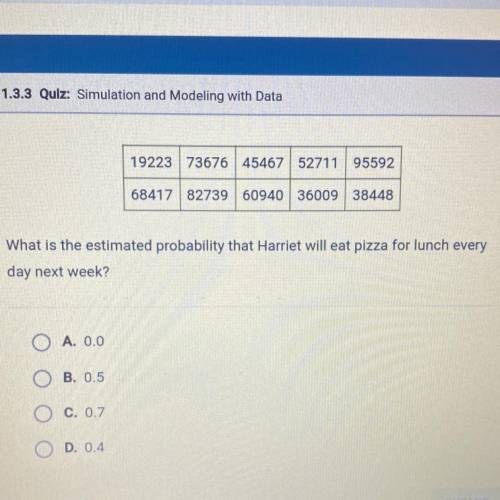
Harriet buys lunch at school every day. She always gets pizza when it is
available. The cafeteria has pizza about 80% of the time.
Harriet runs a simulation to model this using a random number generator.
She assigns these digits to the possible outcomes for each day of the week:
• Let 0 and 1 = no pizza available
• Let 2, 3, 4, 5, 6, 7, 8, and 9 = pizza available
The table shows the results of the simulation.
19223 73676
45467
52711
95592
68417
82739
60940
36009
38448

Answers: 2


Other questions on the subject: Mathematics
Mathematics, 21.06.2019 16:30, sierrabuckner645
Which of the following is the correct ratio for converting kilograms to grams
Answers: 3
Mathematics, 21.06.2019 18:00, leomessifanboy678
Ateacher noticed 5/8 of the students were wearing either blue shorts or white shorts. write two different ways this could be done.
Answers: 2
Mathematics, 21.06.2019 22:30, qveensentha59
Which of the functions below could have created this graph?
Answers: 1
Mathematics, 21.06.2019 23:40, preciosakassidy
The frequency table shows the results of a survey asking people how many hours they spend online per week. on a piece of paper, draw a histogram to represent the data. then determine which answer choice matches the histogram you drew. in order here is the.. hours online: 0-3, 4-7, 8-11, 12-15, and 16-19. frequency: 5, 8, 10, 8, 7 answer for the question is in the picture! : )
Answers: 2
You know the right answer?
Harriet buys lunch at school every day. She always gets pizza when it is
available. The cafeteria...
Questions in other subjects:

English, 01.12.2019 00:31


Mathematics, 01.12.2019 00:31

History, 01.12.2019 00:31

History, 01.12.2019 00:31
English, 01.12.2019 00:31


