
Mathematics, 05.10.2021 03:10 orladuffy1
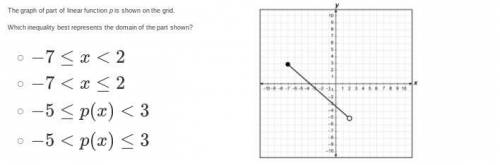
The graph of part of linear function p is shown on the grid. Which inequality best represents the domain of the part shown?

Answers: 2


Other questions on the subject: Mathematics
Mathematics, 21.06.2019 17:40, angelica3752
Solve the given system of equations. 2y= -x+9 , 3x-6= -15
Answers: 2
Mathematics, 21.06.2019 19:40, jennifercastillo1233
If w = 6 units, x = 3 units, and y = 5 units, what is the surface area of the figure? 168 units2 240 units2 144 units2 96 units2
Answers: 1
You know the right answer?
The graph of part of linear function p is shown on the grid.
Which inequality best represents the...
Questions in other subjects:

English, 02.11.2020 18:10


Biology, 02.11.2020 18:10
Mathematics, 02.11.2020 18:10

Mathematics, 02.11.2020 18:10

History, 02.11.2020 18:10


