
Mathematics, 27.09.2021 19:10 thesusan7494
6.3.4 Journal: Graphs of Exponential Functions
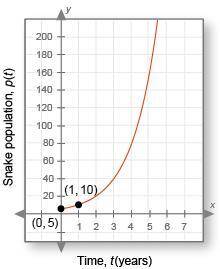
Below is the graph of the boa constrictor population you learned about in the video. The x-axis is t, the time in years, and the y-axis is p(t), the snake population for any given year. In this case, t = 0 indicates the year they started keeping track of the constrictor population. Scientists want to know how the population is changing every two years so they can make predictions about the future.
Analyzing the Data:
1. Is this graph increasing or decreasing? Does this imply that the boa constrictor population is growing or diminishing? (1 point)
2. Looking at this graph, would you agree that the boa constrictor population could become a problem? (1 point)
3. What is the horizontal asymptote of this graph? (1 point)
4. What is the domain? Explain. (1 point)
5. What is the range? Explain. (1 point)
6. What is the y-intercept? What does this mean in terms of the snake population? (1 point)
7. What is the point on the graph when x = 1? What does this mean in terms of the snake population? (1 point)
8. The graph is of a function in the form p(t) = a • bt. What is the function? (2 points)
9. Use this function to estimate the boa constrictor population in 2 years, 3 years, and 4 years. (6 points: 2 points for each year, including 1 point for showing your work and 1 point for the answer)
10. What pattern do you see in years 2, 3, and 4? How is the snake population changing every year? (2 points)
11. How is the snake population changing every two years? (1 point)
Making a Decision:
12. Do you think the snake population can continue to grow in this way forever? Why or why not? (2 points)

Answers: 2


Other questions on the subject: Mathematics
Mathematics, 21.06.2019 16:30, lilrel8602
Karen is financing $291,875 to purchase a house. she obtained a 15/5 balloon mortgage at 5.35%. what will her balloon payment be? a. $220,089.34 b. $219,112.46 c. $246,181.39 d. $230,834.98
Answers: 2
Mathematics, 21.06.2019 17:30, liquidmana42
When the solutions to each of the two equations below are graphed in the xy-coordinate plane, the graphs of the solutions intersect at two places. write the y-cordninates of the points of intersection in the boxes below in order from smallest to largest. y=2x y=x^2-3
Answers: 1
Mathematics, 21.06.2019 17:30, queenpaige2015
How many kilometers are equal to 5 miles? use 1 mile ≈ 1.61 kilometers. !
Answers: 2
Mathematics, 21.06.2019 18:30, zahradawkins2007
If you are trying to move an attached term across the equal sign (=), what operation would you use to move it?
Answers: 2
You know the right answer?
6.3.4 Journal: Graphs of Exponential Functions
Below is the graph of the boa constrictor populatio...
Questions in other subjects:
Mathematics, 07.12.2021 16:50


