
Mathematics, 26.09.2021 17:40 bellabrill
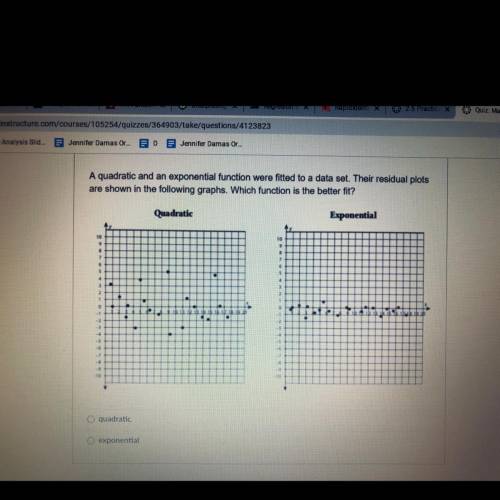
A quadratic and an exponential function were fitted to a data set. Their residual plots are shown in the following graphs. Which function is the better fit?

Answers: 1


Other questions on the subject: Mathematics
Mathematics, 21.06.2019 13:00, mahkitheking16
Find the value of a. the diagram is not to scale. a quadrilateral is drawn. the upper and lower sides are parallel. the interior angle in the upper left corner is labeled a degrees. the angle in the upper right corner is labeled 113 degrees. the angle in the lower right corner is labeled b degrees. the angle in the lower left corner is labeled 36 degrees. a. 36 b. 144 c. 54 d. 126
Answers: 1
Mathematics, 21.06.2019 20:30, 2022maldonadoleonel
Your friend uses c=50p to find the total cost, c, for the people, p, entering a local amusement park what is the unit rate and what does it represent in the context of the situation?
Answers: 2
You know the right answer?
A quadratic and an exponential function were fitted to a data set. Their residual plots
are shown...
Questions in other subjects:
Mathematics, 08.10.2021 18:50
Mathematics, 08.10.2021 18:50

English, 08.10.2021 18:50

Business, 08.10.2021 18:50


Mathematics, 08.10.2021 18:50


