
Mathematics, 26.09.2021 14:30 madisonnnn68
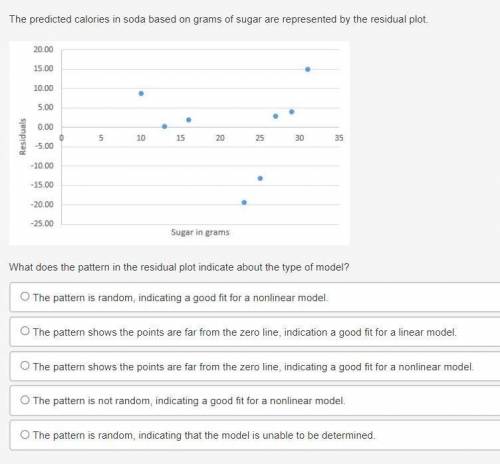
What does the pattern in the residual plot indicate about the type of model?
The pattern is random, indicating a good fit for a nonlinear model.
The pattern shows the points are far from the zero line, indication a good fit for a linear model.
The pattern shows the points are far from the zero line, indicating a good fit for a nonlinear model.
The pattern is not random, indicating a good fit for a nonlinear model.
The pattern is random, indicating that the model is unable to be determined.

Answers: 1


Other questions on the subject: Mathematics
Mathematics, 21.06.2019 20:30, nosugh
If m∠abc = 70°, what is m∠abd? justify your reasoning. using the addition property of equality, 40 + 70 = 110, so m∠abd = 110°. using the subtraction property of equality, 70 − 30 = 40, so m∠abd = 30°. using the angle addition postulate, 40 + m∠abd = 70. so, m∠abd = 30° using the subtraction property of equality. using the angle addition postulate, 40 + 70 = m∠abd. so, m∠abd = 110° using the addition property of equality.
Answers: 2
Mathematics, 22.06.2019 01:50, mynameisjeff1417
According to a study done by de anza students, the height for asian adult males is normally distributed with an average of 66 inches and a standard deviation of 2.5 inches. suppose one asian adult male is randomly chosen. let x = height of the individual. a) give the distribution of x. x ~ b) find the probability that the person is between 64 and 69 inches. write the probability statement. what is the probability?
Answers: 2
Mathematics, 22.06.2019 02:30, misk980
Atrain traveled for 1.5 hours to the first station, stopped for 30 minutes, then traveled for 4 hours to the final station where it stopped for 1 hour. the total distance traveled is a function of time. which graph most accurately represents this scenario? a graph is shown with the x-axis labeled time (in hours) and the y-axis labeled total distance (in miles). the line begins at the origin and moves upward for 1.5 hours. the line then continues upward at a slow rate until 2 hours. from 2 to 6 hours, the line continues quickly upward. from 6 to 7 hours, it moves downward until it touches the x-axis a graph is shown with the axis labeled time (in hours) and the y axis labeled total distance (in miles). a line is shown beginning at the origin. the line moves upward until 1.5 hours, then is a horizontal line until 2 hours. the line moves quickly upward again until 6 hours, and then is horizontal until 7 hours a graph is shown with the axis labeled time (in hours) and the y-axis labeled total distance (in miles). the line begins at the y-axis where y equals 125. it is horizontal until 1.5 hours, then moves downward until 2 hours where it touches the x-axis. the line moves upward until 6 hours and then moves downward until 7 hours where it touches the x-axis a graph is shown with the axis labeled time (in hours) and the y-axis labeled total distance (in miles). the line begins at y equals 125 and is horizontal for 1.5 hours. the line moves downward until 2 hours, then back up until 5.5 hours. the line is horizontal from 5.5 to 7 hours
Answers: 1
You know the right answer?
What does the pattern in the residual plot indicate about the type of model?
The pattern is random...
Questions in other subjects:
Mathematics, 30.01.2021 01:00
Mathematics, 30.01.2021 01:00
Mathematics, 30.01.2021 01:00
Mathematics, 30.01.2021 01:00

English, 30.01.2021 01:00


