
Mathematics, 24.09.2021 14:00 naomicervero
Please help! WILL MARK BRAINLEST
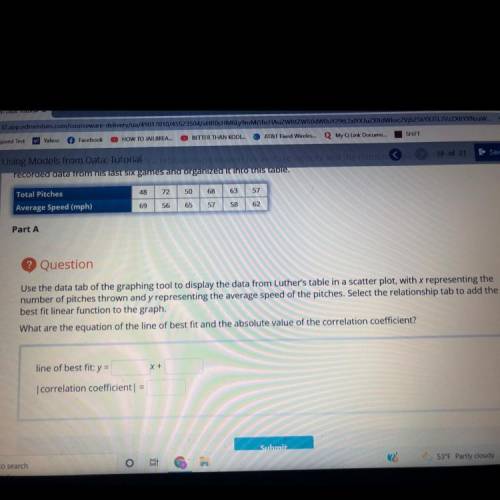
Use the data tab of the graphing tool to display the data from Luther's table in a scatter plot, with x representing the
number of pitches thrown and y representing the average speed of the pitches. Select the relationship tab to add the
best fit linear function to the graph.
What are the equation of the line of best fit and the absolute value of the correlation coefficient?

Answers: 2


Other questions on the subject: Mathematics
Mathematics, 22.06.2019 01:50, claupatri120
Order the equations from least to greatest based on the number of solutions to each equation.-4^x -1 = 3^(-x) – 2 -3x + 6 = 2^x+13^x – 3 = 2x - 2
Answers: 1
Mathematics, 22.06.2019 03:50, aliyahgregory
Amovie producer conducted a survey after the screening of his movie to find out how the film would be received by viewers from different age groups. the columns in the two-way table indicate the numbers of viewers who rated the film on a four-point scale: excellent, good, average, and poor. viewer's age group excellent good average poor marginal totals 16-25 52 42 12 7 113 26-35 33 50 5 9 97 36-45 58 12 28 34 132 which of these observations is supported by the data in the table? note: a rating of good or excellent means the audience liked the movie, while a rating of poor means the audience disliked the movie. a. the majority of the audience in the 26-35 age group disliked the movie. b. among those who liked the movie, the majority were in the oldest age group. c. among those who disliked the movie, the majority were in the 26-35 age group. d. the majority of the audience in the 16-25 age group liked the movie. e. the majority of the audience from all the age groups disliked the movie
Answers: 3
Mathematics, 22.06.2019 05:00, hdjsjfjruejchhehd
Based on the situation in part a, the width of a rectangular garden is x feet, and its length is 5 feet more than twice its width. the right side of the equation, g(x) = 2x2 − 13x + 6, can be factored to g(x) = (2x − 1)(x − 6). this function could represent an inner region of the garden from the first equation, such as a vegetable garden with a border around it. the length of this inner garden would be 2x − 1 feet, and the width would be x − 6, which would leave a 3-foot border around the garden. part d what is the value of g(8) for the function g(x) in part c? what does this value mean in the context of the situation you described in part c?
Answers: 1
You know the right answer?
Please help! WILL MARK BRAINLEST
Use the data tab of the graphing tool to display the data from Lu...
Questions in other subjects:


English, 14.10.2019 08:01


Social Studies, 14.10.2019 08:01

Chemistry, 14.10.2019 08:01
Mathematics, 14.10.2019 08:01
English, 14.10.2019 08:01

History, 14.10.2019 08:01


