Graph this inequality:
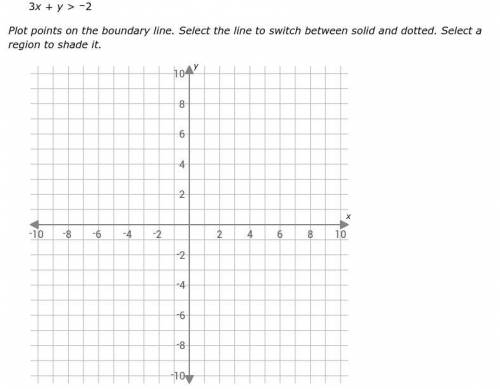
3x + y > –2
Plot points on the boundary line. Select the lin...

Mathematics, 23.09.2021 08:50 jazminpratt0311
Graph this inequality:
3x + y > –2
Plot points on the boundary line. Select the line to switch between solid and dotted. Select a region to shade it.

Answers: 2


Other questions on the subject: Mathematics
Mathematics, 21.06.2019 20:20, rleiphart1
Which of the following values are in the range of the function graphed below? check all that apply ! - will give the answer "brainliest! "
Answers: 1
Mathematics, 21.06.2019 22:00, jessejames48
The coordinates r(1, -3), s(3, -1) t(5, -7) form what type of polygon? a right triangle an acute triangle an equilateral triangle an obtuse triangle
Answers: 1
You know the right answer?
Questions in other subjects:
Mathematics, 18.05.2021 01:00
Mathematics, 18.05.2021 01:00

Geography, 18.05.2021 01:00


History, 18.05.2021 01:00


