
Mathematics, 22.09.2021 15:10 brittanysanders
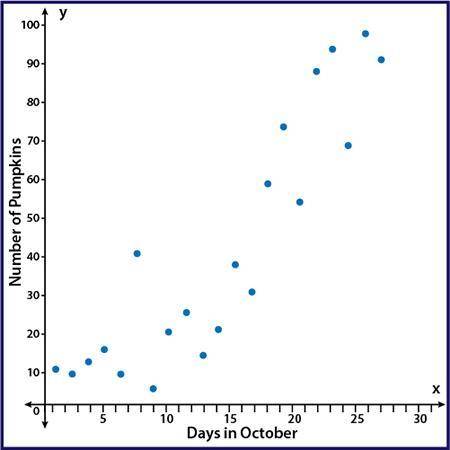
The scatter plot shows the number of pumpkins that have been picked on the farm during the month of October:
Part A: Using computer software, a correlation coefficient of r = 0.51 was calculated. Based on the scatter plot, is that an accurate value for this data? Why or why not? (5 points)
Part B: Instead of comparing the number of pumpkins picked and the day in October, write a scenario that would be a causal relationship for pumpkins picked on the farm. (5 points)

Answers: 1


Other questions on the subject: Mathematics
Mathematics, 21.06.2019 18:30, Jenniferwolf
Ametal rod needs to be 9 feet and 5.5 inches in length. the sections of the poles being used are each 1 foot and 10.5 inches long. how many 1ft 10.5in sections would be needed to complete the 9ft 5.5in metal rod? and how many inches of material will be left?
Answers: 1
You know the right answer?
The scatter plot shows the number of pumpkins that have been picked on the farm during the month of...
Questions in other subjects:
Mathematics, 26.02.2020 06:48
Mathematics, 26.02.2020 06:48
Mathematics, 26.02.2020 06:48
Mathematics, 26.02.2020 06:49

History, 26.02.2020 06:49
Mathematics, 26.02.2020 06:49


