
Mathematics, 20.09.2021 22:30 davelopez979
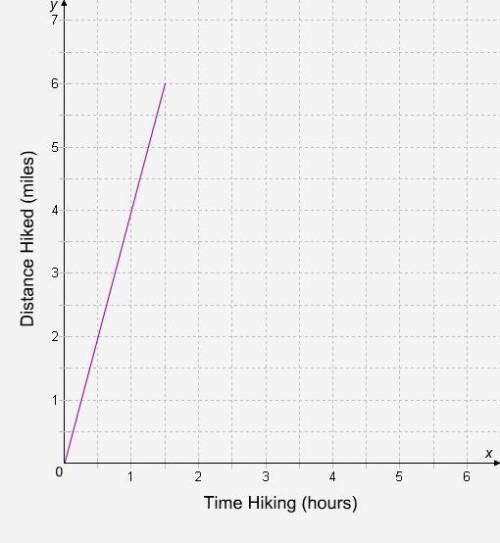
Samantha is hiking through a national park. The graph shows the relationship between the distance she covers (in miles) and the time she spends hiking (in hours).
When Samantha has hiked for 1 1/2 hours, she has covered _
miles.

Answers: 3


Other questions on the subject: Mathematics
You know the right answer?
Samantha is hiking through a national park. The graph shows the relationship between the distance sh...
Questions in other subjects:

Mathematics, 29.07.2020 07:01
Mathematics, 29.07.2020 07:01

Mathematics, 29.07.2020 07:01


