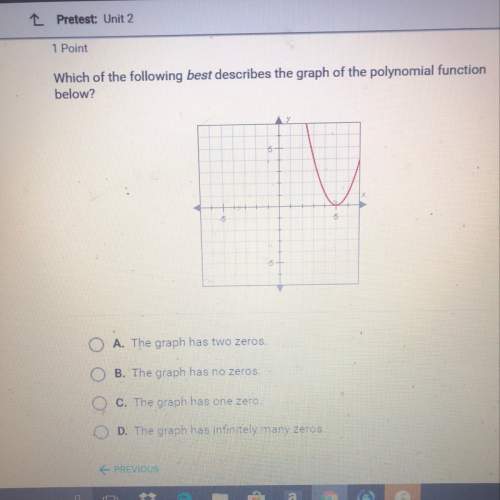
Determine if the following graphs represent a function. Answer"yes" or "no".
...

Mathematics, 18.09.2021 15:10 suzy61
Determine if the following graphs represent a function. Answer"yes" or "no".


Answers: 1


Other questions on the subject: Mathematics

Mathematics, 21.06.2019 18:00, cashhd1212
The given dot plot represents the average daily temperatures, in degrees fahrenheit, recorded in a town during the first 15 days of september. if the dot plot is converted to a box plot, the first quartile would be drawn at __ , and the third quartile would be drawn at __ link to graph: .
Answers: 1

Mathematics, 21.06.2019 22:20, skyhighozzie
(b) suppose that consolidated power decides to use a level of significance of α = .05, and suppose a random sample of 100 temperature readings is obtained. if the sample mean of the 100 temperature readings is x⎯⎯ = 60.990, test h0 versus ha and determine whether the power plant should be shut down and the cooling system repaired. perform the hypothesis test by using a critical value and a p-value. assume σ = 5. (round your z to 2 decimal places and p-value to 4 decimal places.)
Answers: 2

Mathematics, 21.06.2019 23:30, shady1095
Asap (i need to finish this quick) graph complete the sequence of transformations that produces △x'y'z' from △xyz. a clockwise rotation ° about the origin followed by a translation units to the right and 6 units down produces δx'y'z' from δxyz.
Answers: 1

Mathematics, 22.06.2019 04:10, TombRaider167
Which statement describes the slope of the line?
Answers: 1
You know the right answer?
Questions in other subjects:

English, 11.10.2020 21:01

Biology, 11.10.2020 21:01


Chemistry, 11.10.2020 21:01


Mathematics, 11.10.2020 21:01

Engineering, 11.10.2020 21:01


