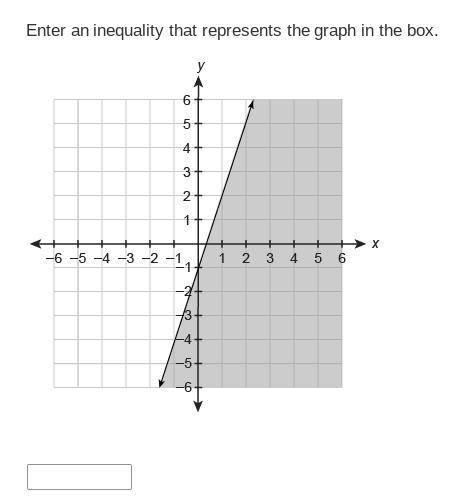
How would I graph this??
...

Mathematics, 18.09.2021 03:10 Arealbot
How would I graph this??


Answers: 1


Other questions on the subject: Mathematics

Mathematics, 21.06.2019 15:00, greekfreekisdbz
Use the graph to determine the range. which notations accurately represent the range? check all that apply. (–∞, 2) u (2, ∞) (–∞, –2) u (–2, ∞) {y|y ∈ r, y ≠ –2} {y|y ∈ r, y ≠ 2} y < 2 or y > 2 y < –2 or y > –2
Answers: 1

Mathematics, 21.06.2019 17:00, 2021CanadyRaniya
The parabola x= √y-9 opens: a.)up b.)down c.)right d.)left
Answers: 1


Mathematics, 22.06.2019 02:00, shekinahconnoll3904
4. bob solved the inequality problem below incorrectly. explain his error and redo the problem showing the correct answer. ? 2x + 5 < 17 ? 2x + 5-5 < 17-5 -2x/-2 < 12/-2 x < -6
Answers: 2
You know the right answer?
Questions in other subjects:


Social Studies, 05.09.2020 02:01

Social Studies, 05.09.2020 02:01


