
Mathematics, 10.09.2021 19:10 lavelma2011
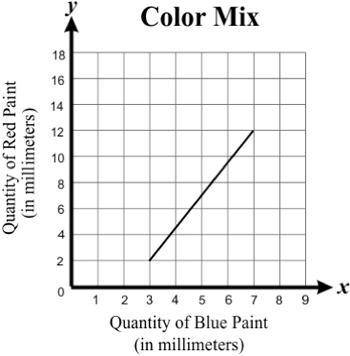
Keira created color panels for a wall using a mix of only red and blue paints. She plotted the quantities of red and blue paints used for each mix and connected them using a line segment, as shown in the graph.
Which statement best describes the domain of the function represented in the graph?
3 ≤ x ≤ 12
3 ≤ x ≤ 7
2 ≤ x ≤ 12
2 ≤ x ≤ 7

Answers: 1


Other questions on the subject: Mathematics
Mathematics, 21.06.2019 15:30, chelseychew32
Question 7 of 47 1 point what is the equation of a line with a slope of 1/2 that passes through the point, (-2,5)? o a. 1/2x+3 o b. y=1/2x+5 o c. y=x+5 o d. y=1/2x+6
Answers: 3
Mathematics, 21.06.2019 19:00, rodriguezzamyy
There is an entrance to the computer room at point e which lies on ab and is 5 feet from point a. plot point e on the coordinate plane. find the distance from the entrance at point e to the printer at point e
Answers: 1
Mathematics, 21.06.2019 20:50, badatmathmate8388
Write the equation in logarithmic form e^x=403.429
Answers: 1
Mathematics, 22.06.2019 00:10, ruddymorales1123
Me i need ! find the asymptote and determine the end behavior of the function from the graph. the asymptote of the function is= blank 1 . for very high x-values, y =blank 2 options for blank 1 x=2 x=-2 x=3 x=-3 blank 2 options moves towards negative infinity moves toward the horizontal asymptote moves toward the vertical asymptote moves toward positive infinity
Answers: 1
You know the right answer?
Keira created color panels for a wall using a mix of only red and blue paints. She plotted the quant...
Questions in other subjects:
Mathematics, 01.02.2022 21:30


Social Studies, 01.02.2022 21:30
Biology, 01.02.2022 21:30

English, 01.02.2022 21:30


