
Mathematics, 07.09.2021 06:10 prynnie
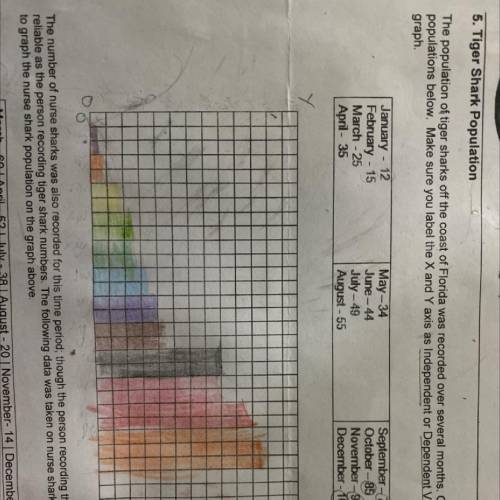
The population of tiger sharks off the coast of Florida was recorded over several months. Graph the tiger shark
populations below. Make sure you label the X and Y axis as Independent or Dependent Variable and title the
graph
January - 12
February - 15
March - 25
April - 35
May-34
June-44
July-49
August - 55
September - 12
October -85
November -99
December - 105
Y.
The number of nurse sharks was also recorded for this time period, though the person recording the number was not as
reliable as the person recording tiger shark numbers. The following data was taken on nurse sharks. Use a different color
to graph the nurse shark population on the graph above.

Answers: 2


Other questions on the subject: Mathematics
Mathematics, 21.06.2019 16:40, lauramount
According to the number line, what is the distance between points a and b? v ++ + + + + -16 -14 -12 -10 -8 + 6 + 4 + -2 + 0 + 2 + 4 + 6 + 8 + 10 + 12 + 14 + 16 o6 units o 7 units 12 units o 14 units
Answers: 1
Mathematics, 21.06.2019 18:10, chyyy3
The means and mean absolute deviations of the individual times of members on two 4x400-meter relay track teams are shown in the table below. means and mean absolute deviations of individual times of members of 4x400-meter relay track teams team a team b mean 59.32 s 59.1 s mean absolute deviation 1.5 s 245 what percent of team b's mean absolute deviation is the difference in the means? 9% 15% 25% 65%
Answers: 2
You know the right answer?
The population of tiger sharks off the coast of Florida was recorded over several months. Graph the...
Questions in other subjects:

Mathematics, 02.10.2019 07:30
Mathematics, 02.10.2019 07:30


Health, 02.10.2019 07:30
Mathematics, 02.10.2019 07:30
Mathematics, 02.10.2019 07:30

Geography, 02.10.2019 07:30


