
Mathematics, 07.09.2021 01:30 whiteshawn0250
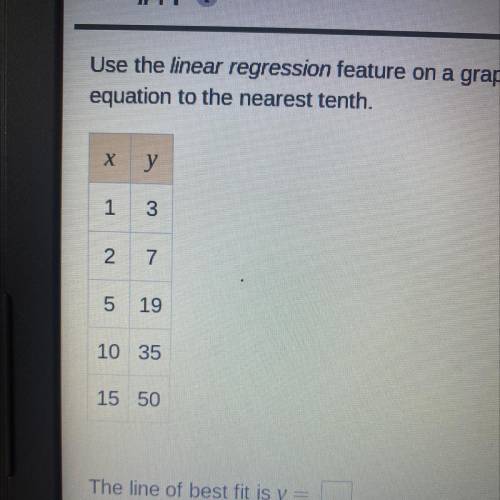
use the linear regression feature on a graphing calculator to find an equation of the line of best fit for the data. round each value in your equation to the nearest tenth.

Answers: 1


Other questions on the subject: Mathematics
Mathematics, 21.06.2019 14:30, serenityburke
Acommunity group sells 2,000 tickets for its raffle. the grand prize is a car. neil and 9 of his friends buy 10 tickets each. when the winning ticket number is announced, it is found to belong to neil's group. given this information, what is the probability that the ticket belongs to neil? a.1/5 b.1/10 c.1/200 d.1/4
Answers: 2
Mathematics, 21.06.2019 16:40, lawrencebenoit7194
This question awards 100 ! i really don’t want to fail i will also mark you !
Answers: 2
Mathematics, 21.06.2019 23:40, amandaelisantos
In the diagram, a building cast a 35-ft shadow and a flagpole casts an 8-ft shadow. if the the flagpole is 18 ft tall, how tall is the building? round the the nearest tenth.
Answers: 2
You know the right answer?
use the linear regression feature on a graphing calculator to find an equation of the line of best f...
Questions in other subjects:


Computers and Technology, 21.12.2019 03:31
Computers and Technology, 21.12.2019 03:31


