
Mathematics, 07.09.2021 01:10 igtguith
PLEASEEE HELP ASAPP HELP!!! LOOK AT THE IMAGE
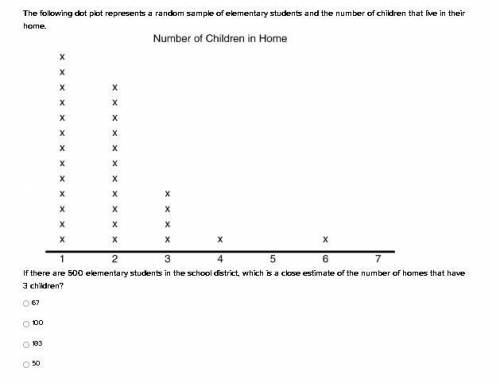
The following dot plot represents a random sample of elementary students and the number of children that live in their home.
If there are 500 elementary students in the school district, which is a close estimate of the number of homes that have 3 children?
67
100
183
50

Answers: 1


Other questions on the subject: Mathematics
Mathematics, 21.06.2019 22:20, jimena15
As voters exit the polls, you ask a representative random sample of voters if they voted for a proposition. if the true percentage of voters who vote for the proposition is 63%, what is the probability that, in your sample, exactly 5 do not voted for the proposition before 2 voted for the proposition? the probability is
Answers: 2
You know the right answer?
PLEASEEE HELP ASAPP HELP!!! LOOK AT THE IMAGE
The following dot plot represents a random sample of...
Questions in other subjects:
Mathematics, 15.12.2020 22:10

Mathematics, 15.12.2020 22:10
Mathematics, 15.12.2020 22:10
Mathematics, 15.12.2020 22:10

English, 15.12.2020 22:10


