
Mathematics, 01.09.2021 07:10 bethdove9466
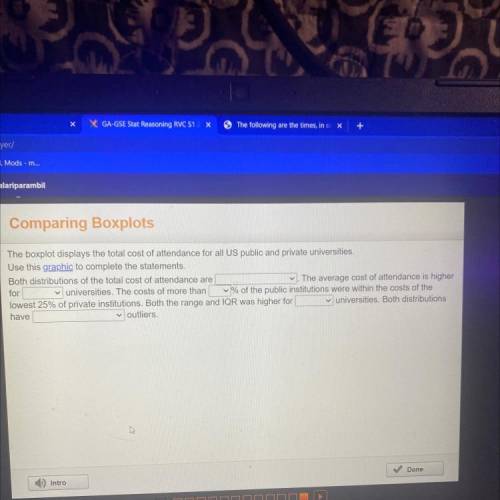
The boxplot displays the total cost of attendance for all US public and private universities.
Use this graphic to complete the statements.
Both distributions of the total cost of attendance are
The average cost of attendance is higher
for ✓ universities. The costs of more than % of the public institutions were within the costs of the
lowest 25% of private institutions. Both the range and IQR was higher for ✓ universities. Both distributions
have
v outliers.

Answers: 1


Other questions on the subject: Mathematics
Mathematics, 21.06.2019 19:30, Robloxdemonduckyt
Піf x = y and y= z, which statement must be true? оа. -x = -2 b. x= z ос. —x = 2 od. 2= x
Answers: 3
You know the right answer?
The boxplot displays the total cost of attendance for all US public and private universities.
Use...
Questions in other subjects:

Chemistry, 12.03.2021 23:00
Mathematics, 12.03.2021 23:00

Biology, 12.03.2021 23:00
Biology, 12.03.2021 23:00

English, 12.03.2021 23:00
Mathematics, 12.03.2021 23:00
Mathematics, 12.03.2021 23:00


