
Mathematics, 31.08.2021 23:30 hemriccaleb1213
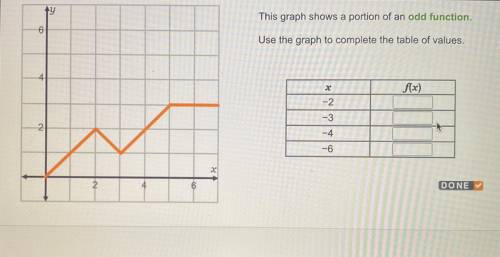
This graph shows a portion of an odd function. Use the graph to complete the table of values.

Answers: 3


Other questions on the subject: Mathematics
Mathematics, 21.06.2019 21:30, mandyangle01
Using pert, adam munson was able to determine that the expected project completion time for the construction of a pleasure yacht is 21 months, and the project variance is 4. a) what is the probability that the project will be completed in 17 months? b) what is the probability that the project will be completed in 20 months? c) what is the probability that the project will be completed in 23 months? d) what is the probability that the project will be completed in 25 months? e) what is the due date that yields a 95% chance of completion?
Answers: 3
Mathematics, 21.06.2019 22:00, NetherisIsTheQueen
You can ride your bike around your block 6 times and the whole neighborhood 5 times in 16 minutes. you can ride your bike around your block 3 times and the whole neighborhood 10 times in 23 minutes. how long does it take you to ride around the neighborhood?
Answers: 2
Mathematics, 22.06.2019 00:00, broooooo4991
Alice is paying her bill at a restaurant. but tax on the cost of a male is 5%. she decides to leave a tip 20% of the cost of the meal plus the tax
Answers: 3
Mathematics, 22.06.2019 01:30, nickeymcorrea
The pyraminx is a rubik's cube-type toy in the shape of a tetrahedron. the pyraminx shown below has edges 15\,\text{cm}15cm long and vertical height h=12.2\,\text{cm}h=12.2cm. the triangle drawn with dashed lines is a right triangle. what is the distance rr? round your answer to the nearest tenth.
Answers: 1
You know the right answer?
This graph shows a portion of an odd function.
Use the graph to complete the table of values.
Questions in other subjects:
Mathematics, 07.10.2020 14:01
Mathematics, 07.10.2020 14:01
Mathematics, 07.10.2020 14:01


History, 07.10.2020 14:01


