
Mathematics, 30.08.2021 23:00 dontworry48
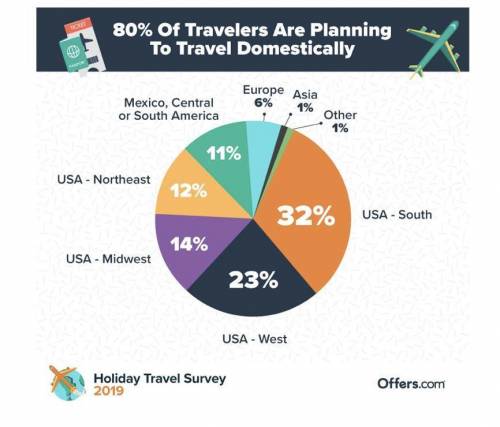
1. The chart below represents the percentage of Americans traveling to each destination.
Which two destinations together account for just over half of Americans' travel plans?
a) USA Northeast
b) Other
c) Asia
d) USA South
e) USA West
f) USA Midwest
g) Europe
h) Mexico, Central or South America
2. According to the graph (not the text) what percentage of Americans planned to travel internationally during the 2019 holiday travel season?
Write your answer as a percentage, but do not include the % symbol as it will confuse the grading software.
3. According to AAA, 115.6 million Americans had plans to travel during the 2019 holiday season. How many of them planned to travel to the United States Midwest?

Answers: 3


Other questions on the subject: Mathematics
Mathematics, 21.06.2019 18:30, andrewmena05
Kayla wants to find the width, ab, of a river. she walks along the edge of the river 65 ft and marks point c. then she walks 25 ft further and marks point d. she turns 90° and walks until her location, point a, and point c are collinear. she marks point e at this location, as shown. (a) can kayla conclude that δ and δ are similar? why or why not? (b) suppose de = 15 ft. what can kayla conclude about the width of the river?
Answers: 2
Mathematics, 21.06.2019 22:00, taliyahjhonson1
The birth weights of newborn babies in the unites states follow in a normal distrubution with a mean of 3.4 kg and standard deviation of 0.6 kg. reaserches interested in studying how. children gain weights decide to take random samples of 100 newborn babies and calculate the sample mean birth weights for each sample
Answers: 1
Mathematics, 21.06.2019 22:00, YoungTadoe437
Find the value of x in each case. give reasons to justify your solutions! d q ∈ pr
Answers: 3
You know the right answer?
1. The chart below represents the percentage of Americans traveling to each destination.
Which two...
Questions in other subjects:
Mathematics, 12.05.2021 14:00

Mathematics, 12.05.2021 14:00

Computers and Technology, 12.05.2021 14:00


Physics, 12.05.2021 14:00


