
Mathematics, 30.08.2021 16:40 yeld
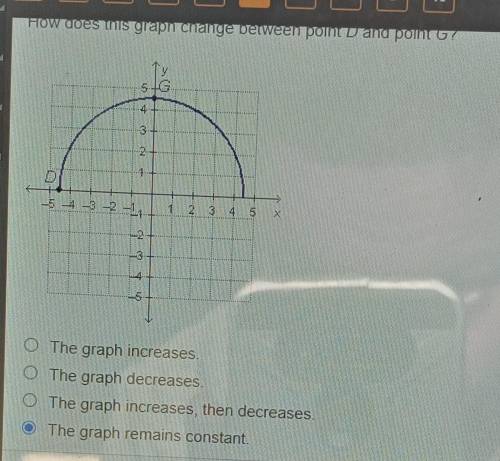
How does this graph change between point D and point G? 3 re 2. 1 D - -3 -2 -1 2 3 4 5 X 5 O The graph increases. O The decreases. O The graph increases, then decreases.

Answers: 3


Other questions on the subject: Mathematics
Mathematics, 21.06.2019 20:30, marahkotelman
Arectangle has a width of 5 cm and a length of 10 cm. if the width is increased by 3, how does the perimeter change?
Answers: 1
Mathematics, 22.06.2019 01:50, Aidanme25
If its non of them tell me..valerie took a day-trip. she drove from her house for a while and took a coffee break. after her coffee break, she continued driving. after 2 hours of driving after her coffee break, her distance from her house was 210 miles. her average speed during the whole trip was 60 miles per hour. valerie created the equation y−210=60(x−2) to represent this situation, where xx represents the time in hours from her coffee break and yy represents the distance in miles from her house. which graph correctly represents valerie's distance from her house after her coffee break?
Answers: 1
You know the right answer?
How does this graph change between point D and point G? 3 re 2. 1 D - -3 -2 -1 2 3 4 5 X 5 O The gra...
Questions in other subjects:

Chemistry, 05.05.2020 18:19

Biology, 05.05.2020 18:19

English, 05.05.2020 18:19


Chemistry, 05.05.2020 18:19
English, 05.05.2020 18:19


