
Mathematics, 26.08.2021 14:00 webbhlharryteach
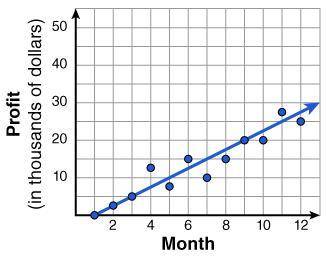
The scatter plot below shows the profit earned each month by a new company over the first year of operation. [attached]
The owner writes a line of best fit equation, shown below, to model the relationship between profit earned and month.
= 2,500 - 2,500
Explain how you know that the line of best fit equation is appropriate. Be sure to mention both the slope and -intercept in your response.

Answers: 3


Other questions on the subject: Mathematics
Mathematics, 21.06.2019 18:00, jenniferkane408
Look at arnold's attempt to solve the equation for b: 3b = 12 b = 3 · 12 b = 36 describe the mistake that arnold made.
Answers: 2
Mathematics, 21.06.2019 20:00, soph10131
M the table below represents a linear function f(x) and the equation represents a function g(x): x f(x)−1 −50 −11 3g(x)g(x) = 2x − 7part a: write a sentence to compare the slope of the two functions and show the steps you used to determine the slope of f(x) and g(x). (6 points)part b: which function has a greater y-intercept? justify your answer. (4 points)
Answers: 3
You know the right answer?
The scatter plot below shows the profit earned each month by a new company over the first year of op...
Questions in other subjects:
Mathematics, 25.02.2021 01:50
Mathematics, 25.02.2021 01:50

Physics, 25.02.2021 01:50
Mathematics, 25.02.2021 01:50

Mathematics, 25.02.2021 01:50
Mathematics, 25.02.2021 01:50


