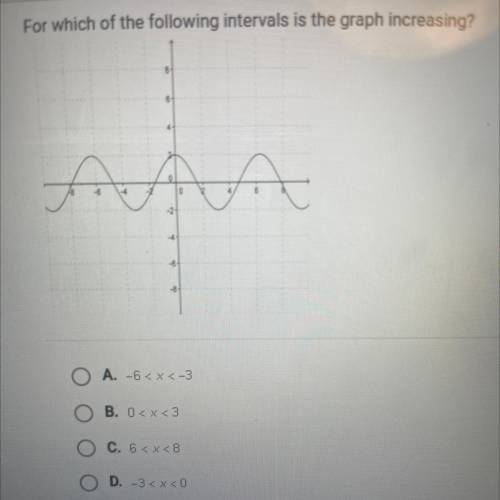
For which of the following intervals is the graph increasing?
O A. -6 < x <-3
OB. 0
O...

Mathematics, 26.08.2021 06:00 jaffeisabel
For which of the following intervals is the graph increasing?
O A. -6 < x <-3
OB. 0
O C. 6
D. -3

Answers: 1


Other questions on the subject: Mathematics
Mathematics, 21.06.2019 16:30, GalaxyWolf1895
An automated water dispenser fills packets with one liter of water on average, with a standard deviation of 5 milliliter. the manual says that after a year of operation the dispenser should be tested to see if it needs recalibration. a year later a number of filled packets are set aside and measured separately. it is found that the average packet now contains about 0.995 liters. does the dispenser need calibration? explain your answer.
Answers: 2
Mathematics, 21.06.2019 19:30, morganamandro9437
[15 points]find the quotient with the restrictions. (x^2 - 2x - 3) (x^2 + 4x + 3) ÷ (x^2 + 2x - 8) (x^2 + 6x + 8)
Answers: 1
Mathematics, 21.06.2019 20:00, dathanboyd
Cody started biking to the park traveling 15 mph, after some time the bike got a flat so cody walked the rest of the way, traveling 4 mph. if the total trip to the park took 6 hours and it was 46 miles away, how long did cody travel at each speed? solve using rate times time= distance
Answers: 1
You know the right answer?
Questions in other subjects:

Law, 20.12.2020 17:50

English, 20.12.2020 17:50

Social Studies, 20.12.2020 17:50

Advanced Placement (AP), 20.12.2020 17:50

Chemistry, 20.12.2020 17:50

Biology, 20.12.2020 17:50
Chemistry, 20.12.2020 17:50

Computers and Technology, 20.12.2020 17:50


