
Mathematics, 25.08.2021 17:20 QueenKy9576
Use the line plots to answer the question.
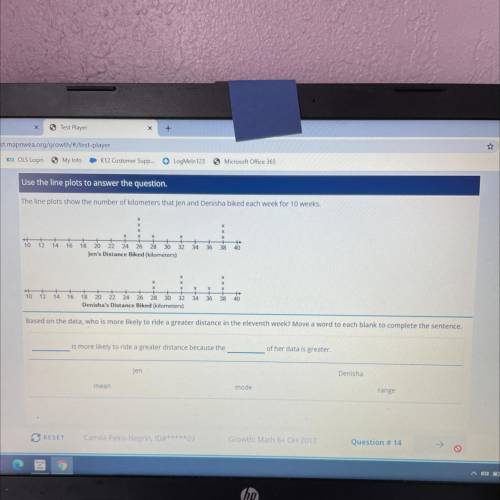
The line plots show the number of kilometers that Jen and Denisha biked each week for 10 weeks.
X
10
12
14
34
36
38
40
16 18 20 22 24 26 28 30 32
Jen's Distance Biked (kilometers)
X
X
10 12
14
16
x
x
18 20 22 24 26 28 30 32
Denisha's Distance Biked (kilometers)
34
36
38
Based on the data, who is more likely to ride a greater distance in the eleventh week? Move a word to each blank to complete the sente
is more likely to ride a greater distance because the
of her data is greater.
Jen
Denisha
mean
mode
range

Answers: 3


Other questions on the subject: Mathematics
Mathematics, 21.06.2019 19:50, gymnastattack
Drag each tile into the correct box. not all tiles will be used. find the tables with unit rates greater than the unit rate in the graph. then tenge these tables in order from least to greatest unit rate
Answers: 2
Mathematics, 21.06.2019 20:00, carltonwashington23
The midpoints of the sides of the large square are joined to form a smaller square. what is the area of the smaller square
Answers: 1
You know the right answer?
Use the line plots to answer the question.
The line plots show the number of kilometers that Jen a...
Questions in other subjects:
Mathematics, 14.01.2020 23:31

English, 14.01.2020 23:31


Social Studies, 14.01.2020 23:31

Social Studies, 14.01.2020 23:31


