
Mathematics, 23.08.2021 01:00 ramirez5571
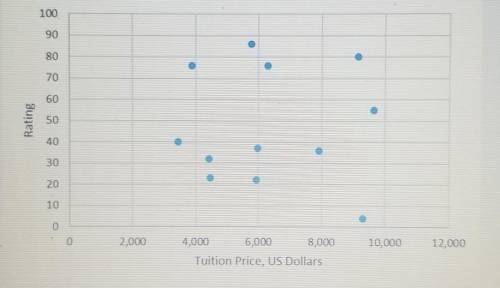
The annual tuition and parent rating of 12 private schools is shown on the scatterplot. The schools are rated on a scale of 0 to 100. Part A: Describe the association shown in the scatterplot. (4 points). Part B: Give an example of a data point that affects the appropriateness of using a linear regression model to fit all the data. Explain. (4 points) Part C: Give an example of a school that is cost effective and rated highly by parents. (2 points)

Answers: 3


Other questions on the subject: Mathematics
Mathematics, 21.06.2019 20:30, nsbegay2007
Tom is the deli manager at a grocery store. he needs to schedule employee to staff the deli department for no more that 260 person-hours per week. tom has one part-time employee who works 20 person-hours per week. each full-time employee works 40 person-hours per week. write and inequality to determine n, the number of full-time employees tom may schedule, so that his employees work on more than 260 person-hours per week. graph the solution set to this inequality.
Answers: 2
Mathematics, 22.06.2019 00:10, sonnyboi2305
Of of at a : $6, $8, $7, $6, $5, $7, $5, $7, $6, $28, $30 is?ato .ato .ato .ato .
Answers: 3
You know the right answer?
The annual tuition and parent rating of 12 private schools is shown on the scatterplot. The schools...
Questions in other subjects:


Mathematics, 23.07.2019 08:40

Mathematics, 23.07.2019 08:40


