
Mathematics, 20.08.2021 14:00 pandamaknae2003
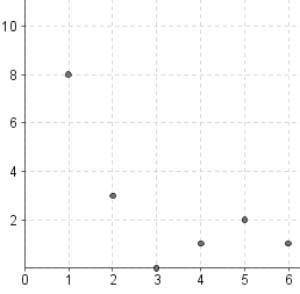
The graph below plots the values of y for different values of x:
What does a correlation coefficient of −0.2 say about this graph?
x and y have a strong, positive correlation
x and y have a weak, positive correlation
x and y have a strong, negative correlation
x and y have a weak, negative correlation

Answers: 1


Other questions on the subject: Mathematics
Mathematics, 21.06.2019 22:00, krandall232
Match the scale and the actual area to the area of the corresponding scale drawing. scale: 1 inch to 4 feet actual area: 128 square feet scale: 1 inch to 7 feet actual area: 147 square feet scale: 1 inch to 8 feet actual area: 256 square feet scale: 1 inch to 5 feet actual area: 225 square feet area of scale drawing scale and actual area scale drawing area: 3 square inches arrowright scale drawing area: 8 square inches arrowright scale drawing area: 4 square inches arrowright scale drawing area: 9 square inches arrowright
Answers: 2
Mathematics, 22.06.2019 03:00, raerea2005
The algebraic expression shown below is missing two whole number constants. determine the constants so that the expression simplified to 14x + 11 4x + 8(x + + + 2x
Answers: 1
You know the right answer?
The graph below plots the values of y for different values of x:
What does a correlation coefficie...
Questions in other subjects:


English, 24.02.2022 15:40

Social Studies, 24.02.2022 15:40


History, 24.02.2022 15:50


