
Mathematics, 18.08.2021 19:50 linnybear300
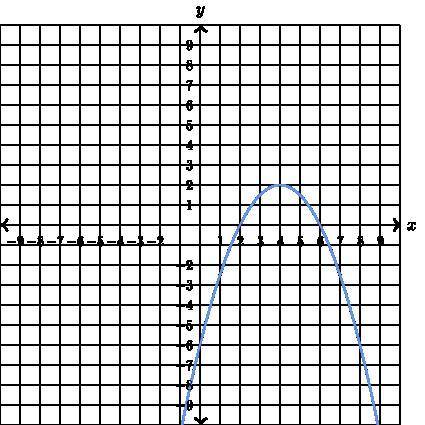
The illustration below shows the graph of y as a function of x.
Complete the following sentences based on the graph of the function.
(Enter the x-intercepts from least to greatest.)
This is the graph of a _ function. The y-intercept of the graph is the function value y=_
The x-intercepts of the graph (in order from least to greatest) are located at x=_
and x = _ The greatest value of y is y=_ and it occurs when x=_
For x between x=2 and = 6 the function value y_ 0

Answers: 1


Other questions on the subject: Mathematics
Mathematics, 21.06.2019 20:00, haileyhale5
What are the domain and range of the function f(x)=2^x+1
Answers: 1
Mathematics, 22.06.2019 04:30, querline87
Simplify 1 divided by 2/3 x (-3) divided by 1/6 x (-10)
Answers: 2
You know the right answer?
The illustration below shows the graph of y as a function of x.
Complete the following sentences b...
Questions in other subjects:


Mathematics, 07.03.2021 14:00
Mathematics, 07.03.2021 14:00


Biology, 07.03.2021 14:00

Chemistry, 07.03.2021 14:00


