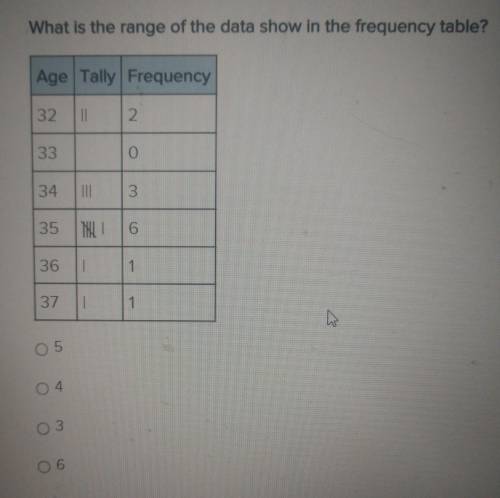
What is the range of the data show in the frequency table? Age Tally Frequency
...

Mathematics, 17.08.2021 01:50 jlozaaaaaa408
What is the range of the data show in the frequency table? Age Tally Frequency

Answers: 2


Other questions on the subject: Mathematics
Mathematics, 21.06.2019 21:00, mathishard353
Finding tbe values of the variables in each kite
Answers: 1
Mathematics, 22.06.2019 00:30, lisettetorres01
You eat $0.85 for every cup of hot chocolate you sell. how many cups do you need to sell to earn $55.25
Answers: 2
Mathematics, 22.06.2019 01:20, blackboy21
1. why is a frequency distribution useful? it allows researchers to see the "shape" of the data. it tells researchers how often the mean occurs in a set of data. it can visually identify the mean. it ignores outliers. 2. the is defined by its mean and standard deviation alone. normal distribution frequency distribution median distribution marginal distribution 3. approximately % of the data in a given sample falls within three standard deviations of the mean if it is normally distributed. 95 68 34 99 4. a data set is said to be if the mean of the data is greater than the median of the data. normally distributed frequency distributed right-skewed left-skewed
Answers: 2
Mathematics, 22.06.2019 03:30, melody12chocolatemil
Math ! will give branliest at a car and truck dealership, the probability that a vehicle is white is 0.25 . the probability that it is a pick up truck is 0.15 . the or obability that it is a white pick up truck is 0.06 . what is the probability that the vehicle is white, given that the vehicle is a pickup truck . round your answer to two decimal places .
Answers: 1
You know the right answer?
Questions in other subjects:

Mathematics, 08.04.2021 19:40
Mathematics, 08.04.2021 19:40


