
Mathematics, 13.08.2021 17:40 Demondevilg
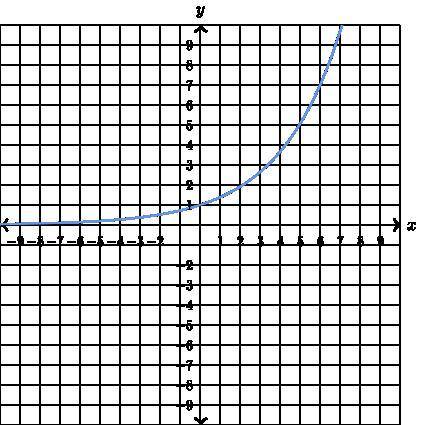
The illustration below shows the graph of y as a function of x.
Complete the sentences below based on the graph of the function.
As x increases, y _
The rate of change for y as a function of x is _
therefore the function is_
For all values of x, the function value y_ 0
The y-intercept of the graph is the function value y=_
When x=6 equals, 6, the function value y=_

Answers: 3


Other questions on the subject: Mathematics
Mathematics, 21.06.2019 17:00, angeleyes42
When only separate discreet points are graphed it is called?
Answers: 1
Mathematics, 21.06.2019 23:30, sandrafina2004
Sally deposited money into a savings account paying 4% simple interest per year. the first year, she earned $75 in interest. how much interest will she earn during the following year?
Answers: 2
Mathematics, 22.06.2019 00:00, angeleyes42
Macy spent $36 on jeans. this was $12 less than twice what she spent on a shirt. which equation to solve this, 12x=36 2x=36-12 2x-12=36 12-2x=36
Answers: 1
You know the right answer?
The illustration below shows the graph of y as a function of x.
Complete the sentences below based...
Questions in other subjects:

History, 20.09.2019 17:00

Social Studies, 20.09.2019 17:00


Physics, 20.09.2019 17:00
Health, 20.09.2019 17:00


English, 20.09.2019 17:00


