
Mathematics, 11.08.2021 21:10 yair7
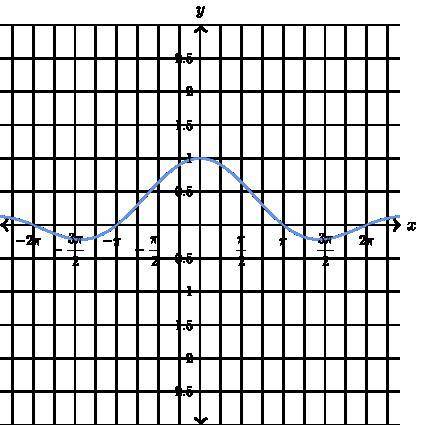
The illustration below shows the graph of y as a function of x.
Complete the following sentences based on the graph of the function.
The y-intercept of the graph is the function value y=_
The smallest positive x-intercept of the graph is located at x=_
The greatest value of y is y=_ and it occurs when x=_
For x between x and x= 2 π the function value y___ 0

Answers: 1


Other questions on the subject: Mathematics
Mathematics, 21.06.2019 15:00, katiebotts18
The diameter of a ball is 8 in. what is the volume of the ball? use 3.14 for pi. enter your answer as a decimal in the box. round only your final answer to the nearest hundredth.
Answers: 2
Mathematics, 21.06.2019 16:30, ikgopoleng8815
11. minitab software was used to find the lsrl for a study between x=age and y=days after arthroscopic shoulder surgery until an athlete could return to their sport. use the output to determine the prediction model and correlation between these two variables. predictor coef se coef t p constant -5.054 4.355 -1.16 0.279 age 0.2715 0.1427 1.9 0.094 r-sq = 31.16%
Answers: 2
Mathematics, 21.06.2019 21:00, asiamuhammad6
Rewrite the following quadratic functions in intercept or factored form. show your work. y = 4x^2 - 19x- 5
Answers: 2
Mathematics, 22.06.2019 00:30, krissymonae
Aline has a slope of negative 1/4 the past two points -5/4 and 1 what is the equation of the line
Answers: 2
You know the right answer?
The illustration below shows the graph of y as a function of x.
Complete the following sentences ba...
Questions in other subjects:

Mathematics, 25.11.2021 08:40

Mathematics, 25.11.2021 08:40

Computers and Technology, 25.11.2021 08:40

Physics, 25.11.2021 08:40

Chemistry, 25.11.2021 08:40


