
Mathematics, 10.08.2021 16:00 JusSomeRandomGuy
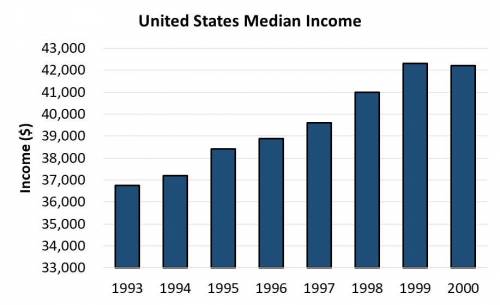
The bar graph shows the median income for families in the United States from 1993 through 2000.
Which two consecutive years saw the largest increase in median income?
A. 1994–1995
B. 1997–1998
C. 1998–1999
D. 1999–2000

Answers: 2


Other questions on the subject: Mathematics
Mathematics, 22.06.2019 01:30, josephmelichar777
Pllz me also i will report if you are in for the 1. complete the table by converting each decimal to a fraction. repeating decimals. 0.31 0.125 0.1607 2. describe any patterns you noticed when converting the decimals in the table above.
Answers: 1
Mathematics, 22.06.2019 02:00, MJyoungboy
The equation y= -16t^2+120 can be used to represent the fridge height above the ground where ti represents time in seconds after she threw the apple how long does it take the apple to hit the ground running your
Answers: 3
Mathematics, 22.06.2019 02:30, lieunekop8fm90
The center on a target has a diameter of 5 inches. the whole target has a diameter of 25 inches. complete the explanation for what part of the whole target is the center. the center of the target takes up % of the whole target.
Answers: 3
You know the right answer?
The bar graph shows the median income for families in the United States from 1993 through 2000.
Whi...
Questions in other subjects:


Mathematics, 24.06.2019 04:40


