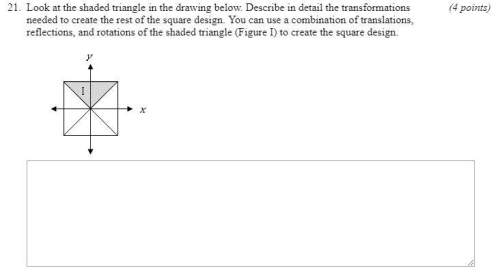
Plz help
Question 7(Multiple Choice Worth 1 points)
(05.01 LC)
A group of 12 students p...

Mathematics, 07.08.2021 20:00 tommy6668
Plz help
Question 7(Multiple Choice Worth 1 points)
(05.01 LC)
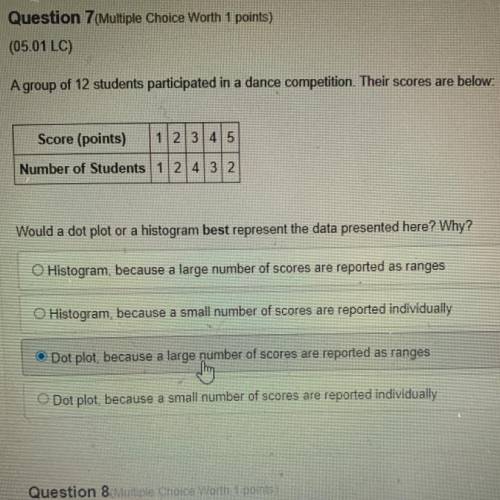
A group of 12 students participated in a dance competition. Their scores are below:
Score (points)
1 2 3 4 5
Number of Students 12432
Would a dot plot or a histogram best represent the data presented here? Why?
Histogram, because a large number of scores are reported as ranges
Histogram, because a small number of scores are reported individually
Dot plot, because a large number of scores are reported as ranges
Dot plot, because a small number of scores are reported individually

Answers: 2


Other questions on the subject: Mathematics
Mathematics, 21.06.2019 14:50, queenkendra16
Which expression is equivalent to 4 square root 6 divided by 3 root 2
Answers: 1
Mathematics, 21.06.2019 17:30, fonsworth5
Kathy spent 5/8 of her money on books and another 1/6 of her money on stationeries. what fraction of kathy’s money was left?
Answers: 2
Mathematics, 21.06.2019 18:30, gracynamos
Express the following as a function of a single angle. cos(60) cos(-20) - sin(60) sin(-20)
Answers: 1
You know the right answer?
Questions in other subjects:
Mathematics, 22.09.2021 01:50
Mathematics, 22.09.2021 01:50

Health, 22.09.2021 01:50
Mathematics, 22.09.2021 01:50

Social Studies, 22.09.2021 01:50


Mathematics, 22.09.2021 01:50


