<= for < or >= for.

Mathematics, 03.08.2021 05:30 anaemigarcia
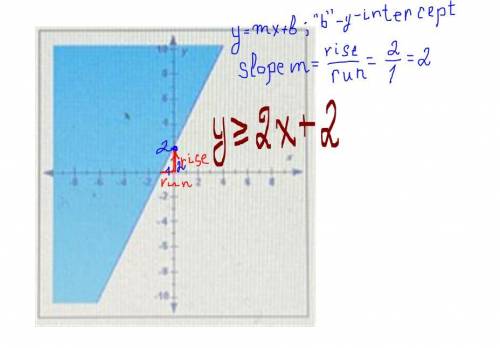
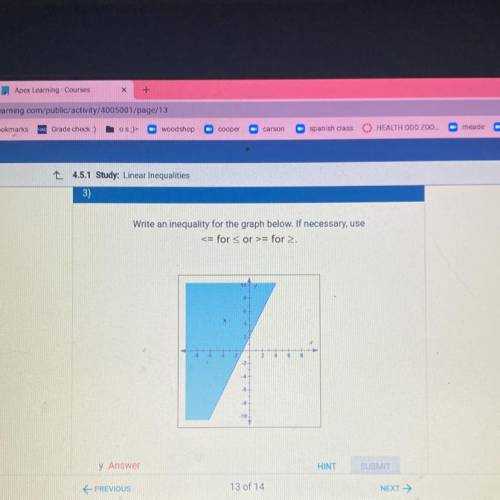
3)
Write an inequality for the graph below. If necessary, use
<= for < or >= for.
Kinda stuck and running out of time

Answers: 1


Other questions on the subject: Mathematics
Mathematics, 21.06.2019 16:20, elkinsmarie88oyzd23
What are the soultion(s) to the quadratic equation 40- x^2=0
Answers: 1
Mathematics, 21.06.2019 16:30, skylarjohnson2683
What is true about the dilation? it is a reduction with a scale factor between 0 and 1. it is a reduction with a scale factor greater than 1. it is an enlargement with a scale factor between 0 and 1. it is an enlargement with a scale factor greater than 1.
Answers: 2
Mathematics, 21.06.2019 18:00, mooreadrian412
The brain volumes (cm cubed) of 50 brains vary from a low of 904 cm cubed to a high of 1488 cm cubed. use the range rule of thumb to estimate the standard deviation s and compare the result to the exact standard deviation of 175.5 cm cubed, assuming the estimate is accurate if it is within 15 cm cubed
Answers: 2
Mathematics, 21.06.2019 18:00, reinaelane77
Ling listed all of the factors of a mystery number: 1,2,4,8,16,32 what is the mystery number?
Answers: 2
You know the right answer?
3)
Write an inequality for the graph below. If necessary, use
<= for < or >= for.
<= for < or >= for.
Questions in other subjects:

History, 27.08.2019 13:30


Social Studies, 27.08.2019 13:30
Mathematics, 27.08.2019 13:30


