
Mathematics, 01.08.2021 21:40 dedgefield
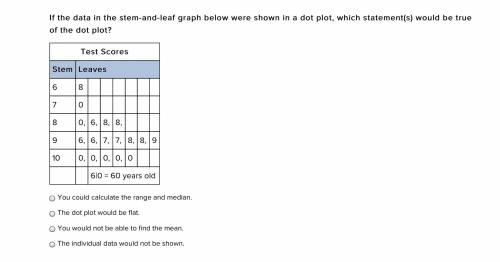
If the data in the stem-and-leaf graph below were shown in a dot plot, which statement(s) would be true of the dot plot?
Test Scores
Stem Leaves
6 8
7 0
8 0, 6, 8, 8,
9 6, 6, 7, 7, 8, 8, 9
10 0, 0, 0, 0, 0
6|0 = 60 years old
You could calculate the range and median.
The dot plot would be flat.
You would not be able to find the mean.
The individual data would not be shown.

Answers: 1


Other questions on the subject: Mathematics
Mathematics, 21.06.2019 12:30, SpookySpooks
Write the equation below the represents the line passing through the point (-3, -1) negative one with a slope of 4
Answers: 2
Mathematics, 21.06.2019 21:00, ballbritez
Which line is parallel to the line that passes through the points (2, –5) and (–4, 1) a. y=-x+5 b. y=-2/3x+3 c. y=2/3x-2 d. y=x+5
Answers: 2
You know the right answer?
If the data in the stem-and-leaf graph below were shown in a dot plot, which statement(s) would be t...
Questions in other subjects:


World Languages, 12.11.2020 21:50
History, 12.11.2020 21:50
Mathematics, 12.11.2020 21:50

Chemistry, 12.11.2020 21:50
Chemistry, 12.11.2020 21:50


