
Mathematics, 31.07.2021 05:10 kiannadgarnica
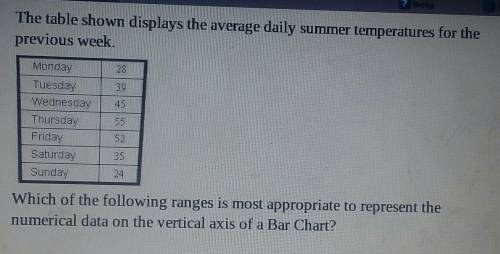
Which of the following ranges is most appropriate to represent the numerical data on the vertical axis of a Bar Chart? OA) 0 to 60 OB) 10 to 20 OC) 0 to 55 OD) 30 to 60

Answers: 2


Other questions on the subject: Mathematics
Mathematics, 21.06.2019 21:30, anaemigarcia
What is the solution to this system of equations? y= 2x - 3.5 x - 2y = -14
Answers: 2
You know the right answer?
Which of the following ranges is most appropriate to represent the numerical data on the vertical ax...
Questions in other subjects:


Social Studies, 13.10.2020 03:01


Mathematics, 13.10.2020 03:01


