subject
Mathematics, 30.07.2021 04:30 1341220857

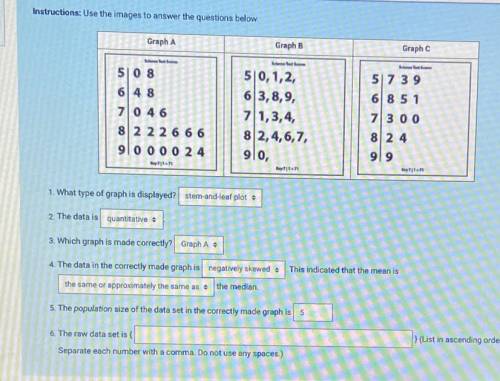
Instructions: Use the images to answer the questions below. Graph A
Graph B
Graph C
5108
6 4 8
7046
8 2 2 2 6 66
90 000 24
50,1,2,
63,8,9,
71,3,4,
8 2,4,6,7,
glo,
57 39
68 5 1
7 3 0 0
824
919
an
11.11
1. What type of graph is displayed? stem-and-leaf plot •
2. The data is quantitative
3. Which graph is made correctly? Graph A :
4. The data in the correctly made graph is negatively skewed . This indicated that the mean is
the same or approximately the same as the median.
5. The population size of the data set in the correctly made graph is 5


Instructions: Use the images to answer the questions below.

Graph A
Graph B
Graph C
5108
6 4 8
70

ansver
Answers: 1

Other questions on the subject: Mathematics

image
Mathematics, 21.06.2019 14:30, lyss12326
Which of the following lines is parallel to x=4? a- 3y=9 b- y=4 c- x=2 d- x=y answer this as soon as possible xoxo lo ; )
Answers: 3
image
Mathematics, 21.06.2019 22:00, kimjooin02
[tex]5 \times1 \frac{12}{13} [/tex] me
Answers: 1
image
Mathematics, 22.06.2019 00:30, danielzgame
Examine this system of equations. what integer should the second equation be multiplied by so that when the two equations are added together, the x term is eliminated? 3/4x+1/7y=6 1/8x-3/5y=16
Answers: 3
image
Mathematics, 22.06.2019 01:30, jjimenez0276
Talia took the bus from her home to the bank and then walked back to her home along the same route. the bus traveled at an average speed of 40 km/h and she walked at an average speed of 5 km/h. to determine the time, x, that it took talia to walk home, she used the equation 40(0.9 – x) = 5x. the time of trip 2 is hours. the distance of trip 1 is km.
Answers: 1
You know the right answer?
Instructions: Use the images to answer the questions below. Graph A
Graph B
Graph C

Questions in other subjects: