
Mathematics, 28.07.2021 06:50 jroig42
Can someone please help me as fast as possible, I'd really appreciate it!!
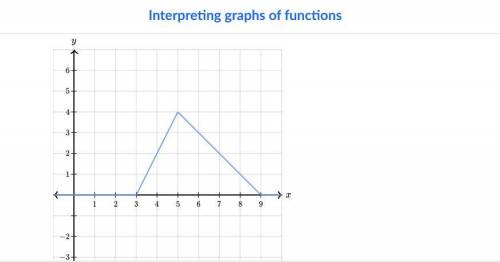
The illustration below shows the graph of y as a function of x.
Complete the following sentences based on the graph.
· Initially, as x increases, y _.
· Afterward, the slope of the graph of the function is equal to _ for all x between x=3 and x=5.
· The slope of the graph is equal to _ for x between x=5 and x=9.
· The greatest value of y is y= _, and it occurs when x= _.

Answers: 2


Other questions on the subject: Mathematics
Mathematics, 22.06.2019 01:00, mdegracia73
The actual length of side t is 0.045cm. use the scale drawing to find the actual side length of w
Answers: 1
Mathematics, 22.06.2019 02:40, torybobadilla
Explain how the quotient of powers was used to simplify this expression.
Answers: 1
Mathematics, 22.06.2019 03:00, jojojolie8570
∠1 and ∠2 are vertical angles. ∠2 has a measure of 63°. what is the measure of ∠1 ? enter your answer in the box.
Answers: 2
You know the right answer?
Can someone please help me as fast as possible, I'd really appreciate it!!
The illustration below s...
Questions in other subjects:

Mathematics, 14.05.2021 04:00

History, 14.05.2021 04:00

Spanish, 14.05.2021 04:00

Physics, 14.05.2021 04:00
Physics, 14.05.2021 04:00

Arts, 14.05.2021 04:00
Mathematics, 14.05.2021 04:00


